Key Highlights
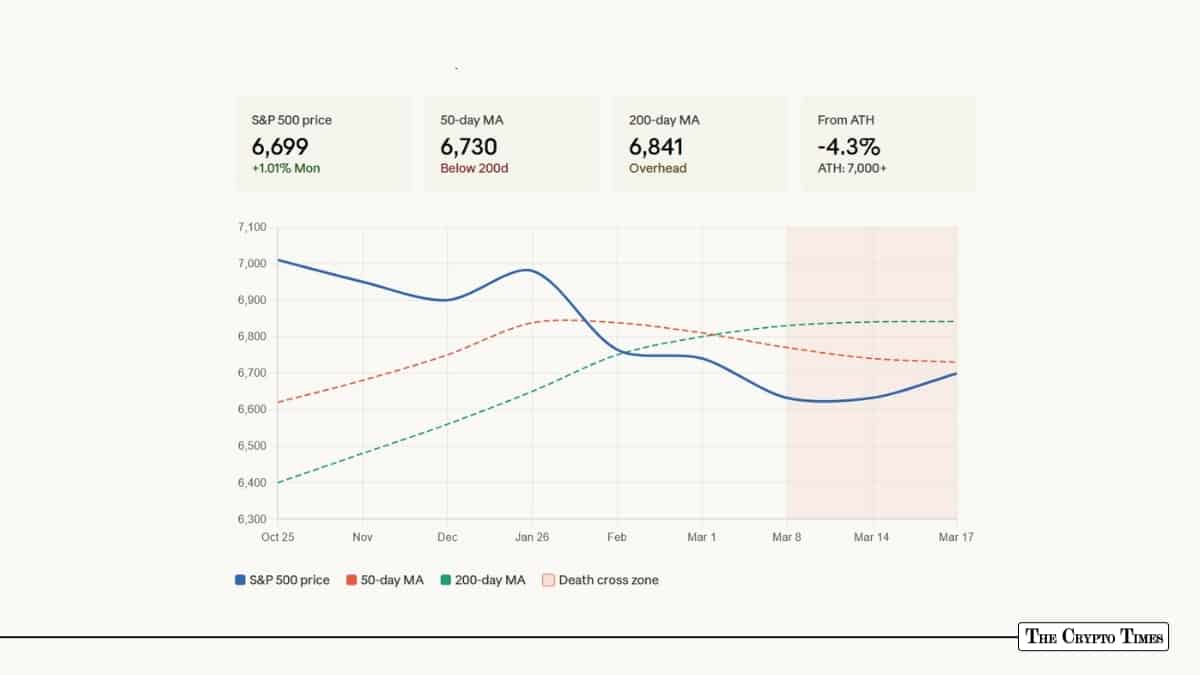
- The S&P 500 has triggered a “mini death cross” (20-day MA below 50-day MA) and the full death cross (50-day below 200-day) is forming, with the 50-day MA at 6,730 now below the 200-day at 6,841.
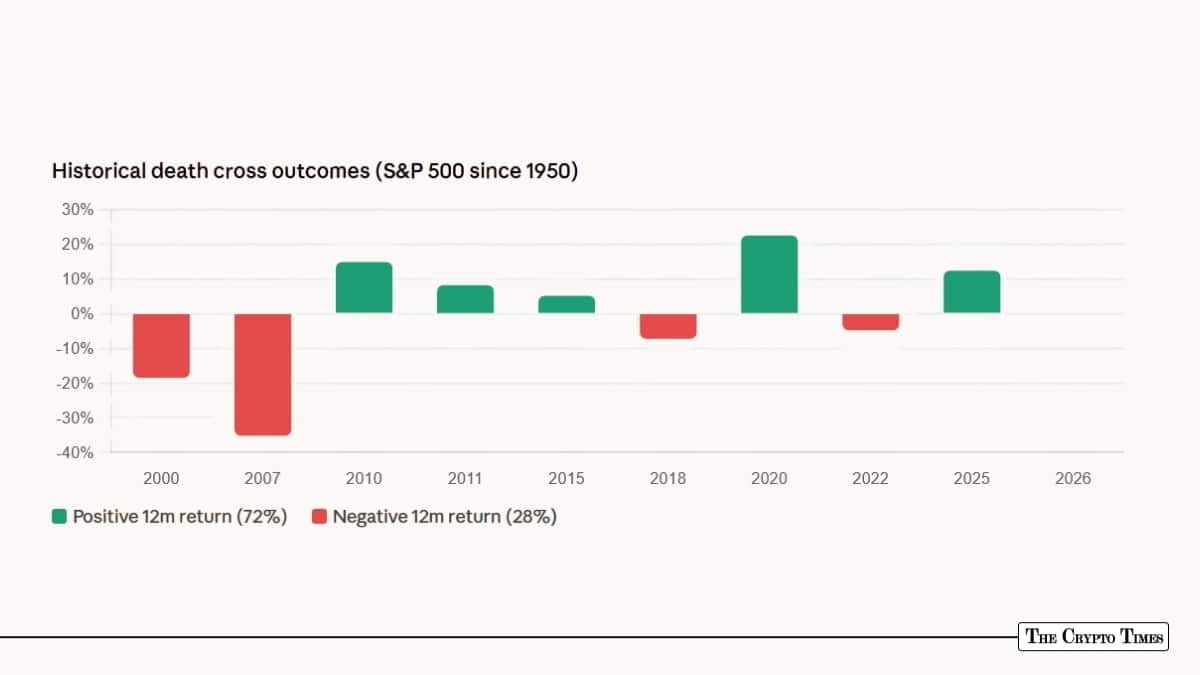
- Historically, 72% of death crosses since 1950 produced positive 12-month returns, averaging 6.3%—the pattern is far less ominous than its name suggests.
- Bitcoin has rallied 25% from its February low of $60,000 to $73,717, testing critical resistance at $74,000-$74,500.
- On-chain data shows record whale accumulation (91,000 BTC in 90 days), exchange reserves at 7-year lows, and the weekly RSI at levels only seen at the 2015 and 2018 cycle bottoms.
- Our CMT analysis assigns a 55% probability that this is a genuine trend reversal rather than a bull trap, conditional on a weekly close above $74,500.
The macro backdrop: War, oil, and a nervous fed
Financial markets are navigating one of the most complex macro environments since the 2022 energy crisis. The U.S.-Iran conflict, which escalated with strikes on key Iranian sites and Tehran’s retaliatory attacks, has sent oil prices surging above $95 per barrel and kept the Strait of Hormuz shipping lanes under threat. The Federal Reserve, facing a 99% probability of holding rates steady at its March 17-18 meeting according to CME FedWatch, finds itself paralyzed between rising energy-driven inflation pressures and the risk of tipping the economy into recession.
Against this backdrop, a striking divergence has emerged between traditional equities and cryptocurrency markets. While the S&P 500 struggles below its key moving averages and grapples with ominous technical signals, Bitcoin (BTC) has staged a powerful rally that has caught many institutional players off-guard. Understanding this divergence and whether it represents a legitimate regime shift or a temporary dislocation—is critical for portfolio positioning heading into Q2 2026.
S&P 500 Death Cross: Anatomy of a bearish signal
The S&P 500 closed at 6,699.38 on Monday, March 16, following a 1.01% rebound as oil prices briefly retreated from intraday highs. However, the technical picture remains deeply troubled. The index’s 50-day moving average now sits at 6,729.64—below the 200-day moving average at 6,841.46. This crossover, where the shorter-term trend line falls beneath the longer-term one, is the textbook “death cross” that technical analysts have been watching for weeks.
Current technical levels
| Indicator | Level | Signal |
|---|---|---|
| S&P 500 Price | 6,699 | Below both MAs |
| 50-Day MA | 6,730 | Falling |
| 200-Day MA | 6,841 | Flattening |
| Key Resistance | 6,731–6,782 | Former support, now overhead |
| Next Support | 6,500 | Psychological level |
| VIX | 23.47 | Elevated but not panic |
The deterioration was progressive. Between March 6 and March 10, the 20-day moving average crossed below the 50-day average—what analysts call a “mini death cross”—on trading volume approximately 25% above the monthly average. This was not retail panic; it bore the hallmarks of institutional distribution. Major hedge funds and Commodity Trading Advisors (CTAs) have pivoted from net-long to neutral or short positions. J.P. Morgan’s equity strategists have described the environment as “valuation saturation,” arguing that AI capital expenditures have not yet produced the productivity gains needed to sustain a 40x Shiller CAPE ratio.
Historical perspective: Death crosses are not death sentences
The name “death cross” inspires far more fear than the data warrants. Since 1950, the S&P 500 has generated an average return of +6.3% and a median return of +10.5% in the 12 months following a death cross, with 72% of the 36 historical occurrences producing positive results. Moreover, when the maximum drawdown reached 15% or more within one month of a death cross — conditions somewhat analogous to the current correction — the average 12-month gain jumps to 16%, with 10 out of 12 cases ending in the green.
The death cross is, by construction, a lagging indicator. By the time the 50-day MA crosses below the 200-day, much of the selling pressure has already been absorbed. The signal is better understood as a confirmation of weakness that has already occurred rather than a prediction of weakness to come.
| Death Cross Year | 12-Month Return | Outcome |
|---|---|---|
| 2000 | -18.5% | Bearish (dot-com crash) |
| 2007 | -35.2% | Bearish (financial crisis) |
| 2010 | +14.8% | Bullish |
| 2011 | +8.2% | Bullish |
| 2015 | +5.1% | Bullish |
| 2018 | -7.3% | Bearish |
| 2020 | +22.5% | Bullish (COVID recovery) |
| 2022 | -4.8% | Bearish |
| 2025 | +12.3% | Bullish |
Likely S&P 500 outcome
The critical zone to watch is 6,731–6,782, which served as support in December and early February before breaking down in early March. The index is now retesting this zone from below. A reclamation with a daily close above 6,782 would signal the correction is likely over and open the door toward retesting the 200-day MA at 6,841. Failure to reclaim this zone suggests a sideways consolidation between 6,400 and 6,800 through Q2, unless a resolution to the Iran conflict triggers a relief rally.
Goldman Sachs maintains a year-end 2026 target of 7,600, implying roughly 13% upside from current levels, predicated on AI productivity gains materializing across broader corporate America. However, their analysts acknowledge that any further escalation in Middle Eastern tensions could drag the index toward a bear-case scenario of 5,400.
Bitcoin technical analysis
Bitcoin’s latest rebound is drawing renewed attention across the market, but the key question remains unchanged: is this a real trend reversal or just another relief rally inside a broader downtrend?
To assess that, the chart needs more than a surface-level read. A deeper technical review looks at multiple layers together, including broader trend structure, Elliott Wave positioning, momentum indicators, Fibonacci zones, volume-based support and resistance, on-chain signals, and Bitcoin’s macro correlation with wider risk assets. Taken together, these indicators help determine whether BTC’s recovery from its February lows has enough strength to sustain or whether the move risks fading into a bull trap.
Bitcoin price snapshot: March 17, 2026
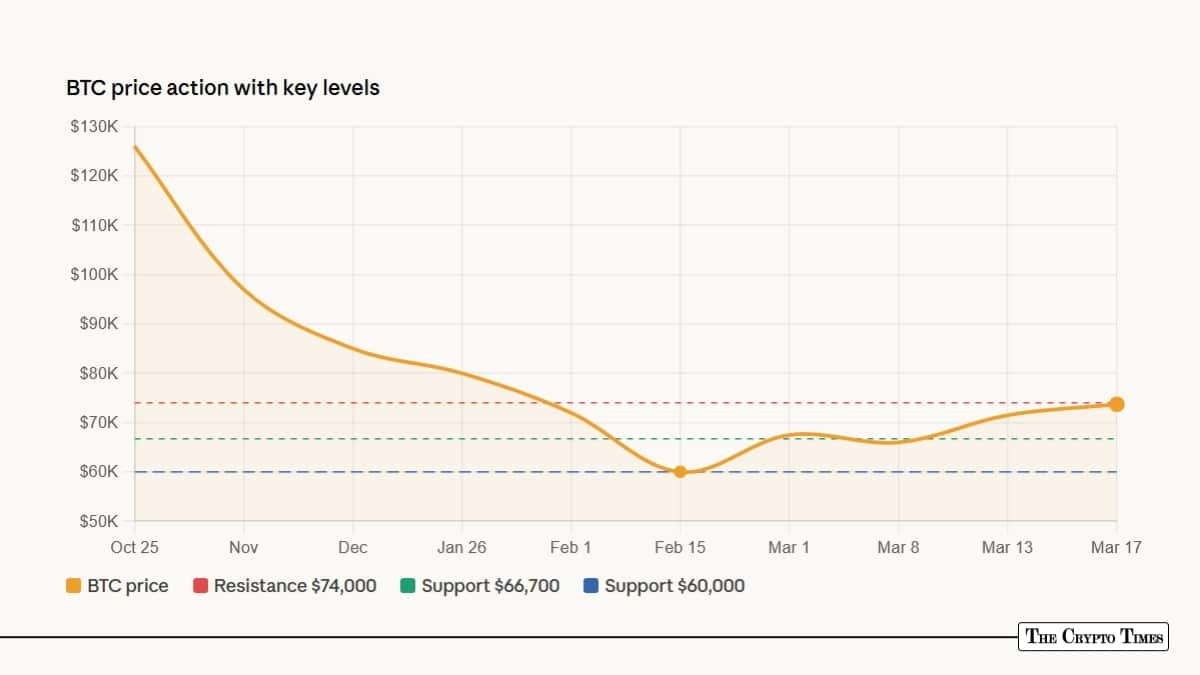
At the time of writing, Bitcoin is trading at $73,717, down $165 over the past 24 hours but still up roughly $3,900 on the week. The asset remains about 41.5% below its all-time high of $126,025, while recovering nearly 25% from its February low near $60,000. Bitcoin’s market capitalization stands at $1.33 trillion, while the Fear & Greed Index sits at 40, suggesting a still-cautious market mood. Meanwhile, the MVRV Z-Score at 1.2 shows BTC is no longer deeply undervalued but also not yet in the overheated territory usually seen near major cycle tops.
Multi-timeframe trend structure
The primary trend, measured on the weekly chart, remains bearish. Bitcoin topped at approximately $126,025 in October 2025 and has declined roughly 41% over the subsequent five months. The weekly MACD has confirmed a bearish crossover, and the weekly RSI recently hit 27.48 — a level not seen since December 2018. On this timeframe alone, the structure favors further downside or extended consolidation.
However, the daily chart tells a different story. Investtech’s analysis, updated March 17, identifies a rising short-term trend channel with support at $66,700 and resistance at $89,000. Investing.com’s aggregate technical indicator signals a “Strong Buy” on the daily timeframe, with 8 of 12 moving average signals pointing bullish. The conflict between weekly bearish and daily bullish structure is precisely the condition that precedes either a confirmed trend reversal or a bear market rally.
Elliott Wave positioning
The move from $126,000 (October 2025) to $60,000 (February 2026) represents a completed five-wave impulse decline or, more likely, the A-wave of a larger ABC corrective structure. The current rally from $60,000 to $74,500 maps to either:
- Wave 1 of a new impulse if the cycle bottom is in, or
- The B-wave of an expanded flat correction that would target $50,000–55,000 for Wave C.
The distinction is critical. A B-wave rally typically retraces 50–78.6% of Wave A before reversing violently. A 50% retracement of the $126K-to-$60K decline targets approximately $93,000, while 61.8% targets $100,800. At $74,000, the current rally has retraced only 21% of the total decline—well below typical B-wave territory. This actually argues against the bull trap thesis, as B-waves typically carry further before reversing.
The invalidation level for the bearish Elliott count is a sustained move above $80,000, which would make the corrective interpretation increasingly untenable.
Momentum and oscillators
The RSI(14) on the daily chart sits at approximately 50—precisely neutral, offering room for movement in either direction. More revealing is the implied volatility picture: Bitcoin’s annualized 30-day implied volatility (BVIV) has dropped to a two-week low of 55%, which historically supports continued spot price rallies as compressed vol tends to resolve with directional moves.
On the derivatives side, however, caution flags remain. On Deribit, Bitcoin put options remain priced higher than equivalent calls, indicating institutional demand for downside protection persists even as spot prices rally. Funding rates on Binance perpetual futures are slightly negative at -0.0065%, suggesting leveraged traders remain positioned for further downside—a condition that often precedes short squeezes when combined with strong spot buying.
Fibonacci levels and volume profile
| Fibonacci Level | Price | Significance |
|---|---|---|
| Swing Low (0%) | $65,043 | March 9 low |
| 23.6% Retracement | $67,177 | First support |
| 38.2% Retracement | $68,497 | Secondary support |
| 50% Retracement | $69,564 | Key pivot |
| 61.8% Retracement | $70,630 | Golden ratio |
| 100% (Swing High) | $74,084 | Critical resistance |
| Key Resistance Above | $80,000 | Breakout confirmation |
Bitcoin is currently testing the 100% Fibonacci retracement of the most recent swing at $74,084—the exact level where corrective rallies typically face their most significant test. A sustained weekly close above this level would represent a higher high relative to the previous swing and shift the short-term structure from corrective to impulsive. Rejection here is the highest-probability bull trap trigger.
At the current setup $74,000 is likely to act as the key breakout level. A high-volume breach above this zone could trigger a move toward $80,000, while failure to hold would likely see Bitcoin revert to the $65,000–$72,000 trading range that has defined price action since early February.
On-chain analysis—the differentiator
This is where the analysis becomes decisively informative and where Bitcoin’s analytical framework diverges most powerfully from traditional equity analysis. The on-chain data paints a picture that is difficult to reconcile with the bull trap thesis.
Exchange reserves: 7-year low
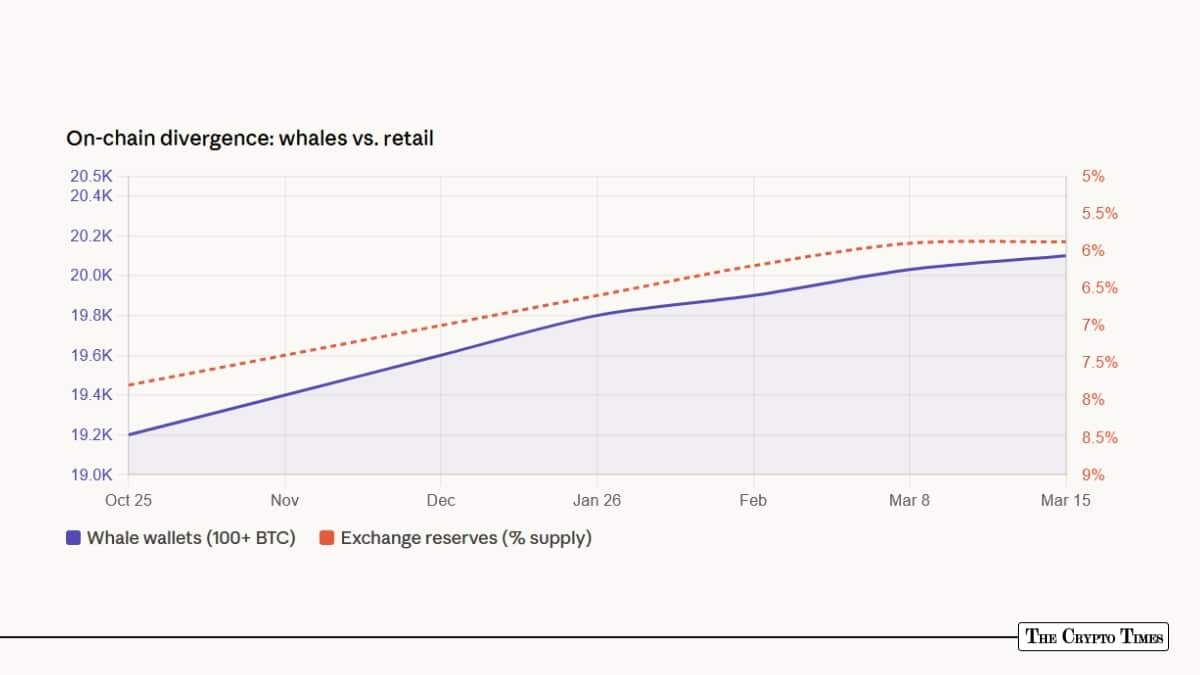
Bitcoin held on exchanges has plunged to 5.88% of circulating supply, the lowest level since 2017. This metric measures the amount of Bitcoin available for immediate sale. When reserves fall, it signals that holders are moving coins to cold storage for long-term holding rather than positioning to sell. The decline has accelerated even as prices dropped 41% from the all-time high, indicating conviction rather than capitulation.
Whale accumulation: Record scale
Whale addresses holding 100 or more BTC have surpassed 20,000 for the first time in Bitcoin’s history. Addresses holding 1,000 BTC or more have expanded from 2,082 in December 2025 to 2,140 in mid-March 2026, collectively adding approximately 91,000 BTC ($6.5 billion at current prices) over just 90 days. This accumulation occurred against a backdrop of extreme fear, with the Fear & Greed Index reading as low as 12 earlier this month.
The pattern echoes the November 2022 post-FTX environment, when a nearly identical divergence between whale accumulation and retail panic preceded a 170% rally over the following 12 months.
Long-term holder behavior
Contrary to previous cycle patterns, long-term holders (LTHs) have not distributed supply at the same rate as in 2021. This structural shift suggests the market may be developing a new floor dynamic, where institutional and long-term conviction holders absorb supply that would otherwise create selling pressure during corrections.
ETF flows: The institutional bid returns
U.S. spot Bitcoin ETFs have recorded approximately $1.3 billion in net inflows during March, potentially marking the first positive month for flows since October 2025. ETF assets under management have climbed to $97.04 billion, up from $93.08 billion one month ago.
Moreover, Strategy Inc. purchased 22,337 BTC for $1.57 billion last week at an average price of approximately $70,194, bringing its total holdings to 761,068 BTC.
Bitcoin on-chain scorecard
Despite the warning signs, the broader on-chain backdrop still leans constructive.
Exchange reserves have dropped to 5.88% of total supply, marking a seven-year low and pointing to reduced sell-side liquidity. Whale wallets holding 100 BTC or more have climbed to 20,031, an all-time high, while whale accumulation has reportedly reached 91,000 BTC over the past 90 days. Both metrics suggest larger players are still positioning for upside.
According to TradingView data, the MVRV Z-Score stands at 1.2, down sharply from its earlier 3.8 peak, indicating Bitcoin is no longer trading in overheated territory. Meanwhile, the weekly RSI at 27.48 sits near levels historically seen around major cycle bottoms, including 2015 and 2018. On the institutional side, spot Bitcoin ETFs have posted $1.3 billion in net inflows so far in March, adding another supportive signal for the medium-term trend.
Still, not all positioning data is encouraging. Whale profit-taking near $74,000 remains active, retail FOMO buying appears to be building, and Deribit options skew continues to favor puts over calls, showing traders are still paying up for downside protection.
The takeaway here is simple: Bitcoin’s broader structure still looks stronger than the headline volatility suggests, but the market is also entering a zone where near-term pullbacks would not be surprising. On-chain accumulation and shrinking exchange supply support the bullish case, while whale selling and defensive derivatives positioning warn that upside may not come in a straight line.
Macro correlation and decoupling
Perhaps the most significant development of the past week is Bitcoin’s decoupling from traditional risk assets. Since Friday, gold has declined nearly 2% while Bitcoin has climbed roughly 12%, reversing the correlation pattern of recent months. Bitcoin outpaced both the Nasdaq 100 and S&P 500 futures even as the U.S. Dollar Index (DXY) broke above 100 — a move that typically pressures risk assets.
This behavior suggests one of two interpretations. First, Bitcoin may be front-running a macro recovery that equities have not yet priced — a pattern observed in Q1 2019 when BTC bottomed months before the S&P recovered from the Q4 2018 selloff.
Second, Bitcoin may be receiving a temporary safe-haven bid driven by geopolitical uncertainty, which would reverse once the Iran situation either resolves (capital rotates back to equities) or escalates (correlations snap back to 1.0 and everything sells). The on-chain accumulation data leans strongly toward the first interpretation, as cold storage withdrawal behavior is structural and slow-moving, not speculative.
The verdict: 55/45 against bull trap
Synthesizing all six analytical layers, we assign a 55% probability that the current Bitcoin rally represents a genuine trend reversal rather than a bull trap. This assessment is conditional: the key confirmation level is a weekly close above $74,500 with above-average volume.
| Framework | Signal | Verdict |
|---|---|---|
| Weekly Trend | Bearish MACD, oversold RSI | Bearish |
| Daily Trend | Rising channel, 8/12 MAs bullish | Bullish |
| Elliott Wave | Only 21% retracement (below B-wave norm) | Lean Bullish |
| Momentum | RSI 50 (neutral), BVIV falling | Neutral |
| Fibonacci | Testing 100% retracement ($74K) | Pivotal |
| On-Chain | Record whales, 7yr-low reserves, ETFs | Strongly Bullish |
| Macro | Decoupling from equities + DXY | Bullish |
The on-chain evidence is the heaviest weight in this framework. The combination of record whale accumulation, 7-year-low exchange reserves, a weekly RSI reading only seen at confirmed cycle bottoms (2015, 2018), and the return of ETF inflows creates a structural backdrop that is fundamentally inconsistent with a bull trap setup. In previous bull traps (March 2022, August 2022), on-chain metrics showed distribution, rising exchange reserves, and whale selling — the opposite of current conditions.
The primary risk to this thesis is exogenous: an escalation of the Iran conflict severe enough to trigger a broad risk-off cascade where all correlations go to 1.0. In that scenario, even strong on-chain fundamentals would not prevent a repricing of Bitcoin alongside equities, oil, and other risk assets. This tail risk is the primary reason the probability is 55% rather than 70%+.
Scenario matrix: What to watch
Scenario A: Bullish breakout (40% probability)
Bitcoin achieves a weekly close above $74,500, confirming a higher high. ETF inflows accelerate. Iran conflict shows signs of de-escalation, oil retreats below $85, and the S&P 500 reclaims the 6,731–6,782 resistance zone. In this scenario, Bitcoin targets $80,000 initially and $89,000–90,000 resistance by Q2 end. The S&P 500 rallies toward 7,000+ as the death cross resolves bullishly.
Scenario B: Consolidation and retest (35% probability)
Bitcoin rejects at $74,000 resistance and pulls back to the $66,000–$68,000 support zone for re-accumulation. The Iran situation remains unresolved but does not escalate materially. The S&P 500 grinds sideways in the 6,400–6,800 range as earnings catch up to valuations. Bitcoin makes another breakout attempt in April or May, with the structure remaining constructive as long as $65,000 holds.
Scenario C: Macro shock and risk-off cascade (25% probability)
Iran conflict escalates significantly, oil spikes above $120, and the Strait of Hormuz becomes effectively closed to commercial shipping. A global risk-off event sends the S&P 500 toward 6,000–6,200 and Bitcoin toward the $50,000–55,000 institutional accumulation zone. On-chain data suggests this zone would be met with massive buying from whales and institutions, creating a potential generational entry point, but the path there would be violent.
Key levels and signals to monitor
| Asset | Bull Signal | Bear Signal |
|---|---|---|
| Bitcoin | Weekly close > $74,500 | Daily close < $65,000 |
| Bitcoin | ETF inflows > $500M/week sustained | Exchange reserves rising |
| Bitcoin | Funding rates turning positive | Whale distribution accelerating |
| S&P 500 | Daily close > 6,782 | Daily close < 6,500 |
| S&P 500 | VIX drops below 20 | VIX spikes above 35 |
| Macro | Oil drops below $85/barrel | Oil spikes above $120/barrel |
| Macro | Iran ceasefire talks begin | Strait of Hormuz closure confirmed |
Also Read: Weekly Wrap: BlackRock ETH ETF Debuts, Binance vs WSJ, Bitcoin Rebounds to $71K