Key Highlights
- U.S. spot Bitcoin ETFs recorded ~$1B in net inflows over February 24 to 26, snapping weeks of outflows, led by BlackRock’s IBIT.
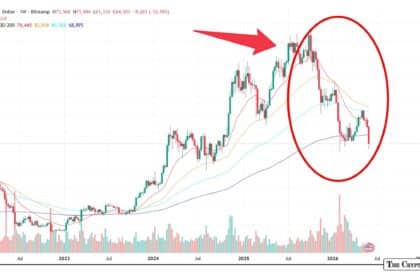
- BTC price rebounded to around $67,500–$67,800 after testing mid-$60K support, with brief spikes near $70K.
- Top indicators like Pi Cycle Top (no crossover), low MVRV Z-Score (~0.45), and undervalued Puell Multiple point to a classic accumulation/bottom setup.
While crypto market sentiment turned optimistic on the edge of macro and fading uncertainty, Wall Street’s spot Bitcoin ETFs just snapped a brutal five-week outflow streak with a vengeance.
Over the past three trading days, from February 24 to 26, U.S. funds pulled in roughly $1.02 billion in net inflows, as per data from SoSoValue. That’s a sharp pivot from the $3.8 billion+ that bled out earlier in the year, when macro jitters and profit-taking had institutions on the run.
The surge kicked off modestly on February 24 with $257.7 million, then exploded on February 25 to $506.51 million, the biggest single-day haul in three weeks. BlackRock’s iShares Bitcoin Trust (IBIT) dominated both sessions, sucking in $297.4 million on February 25 alone and another $275.8 million the next day.

Grayscale’s Bitcoin Trust (GBTC) chipped in $102.5 million on the big day, while Bitwise (BITB) and others added solid chunks. By February 26, inflows cooled to $254.4 million, but the momentum held: three straight positive days and broad participation across most funds.
The apparent spike in Bitcoin price, led it to bounce hard from mid-$60,000s support, briefly tagging near $70,000 before settling around $67,500–$67,800 ahead of weekend. At the time of publishing, it was trading near $67,600, down 1.04% in the past 24 hours—as per CoinMarketCap data.
Bitcoin ‘Top Indicators’ giving bottom signals
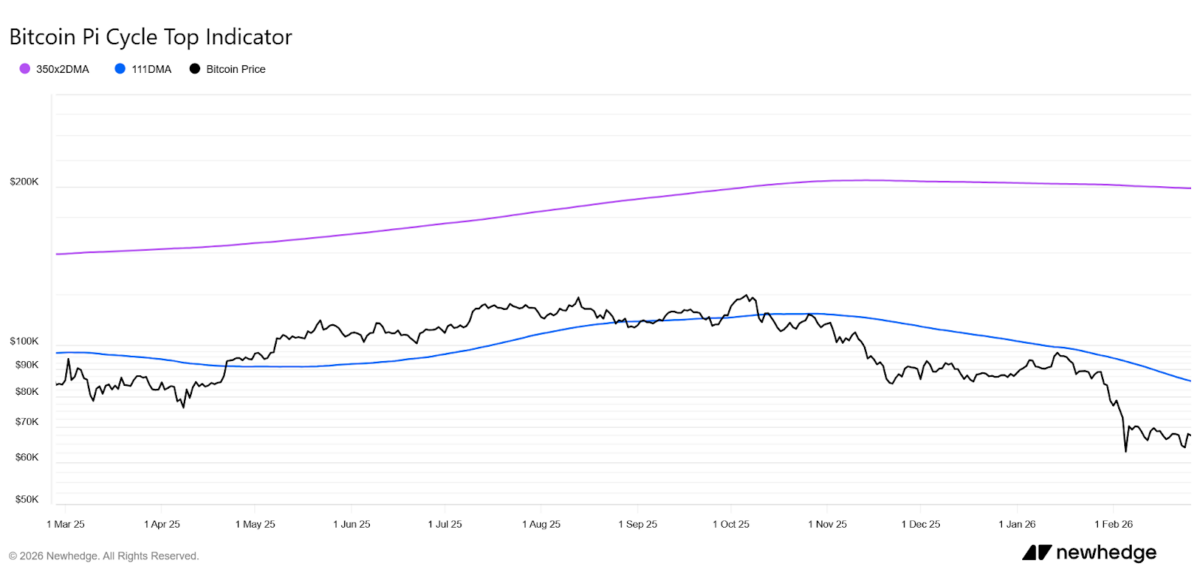
If digged onchain and cycle signals, the picture starts looking more like a classic bottoming setup than a fakeout. The Pi Cycle Top Indicator, famous for nailing prior cycle peaks within days, remains nowhere near a crossover.
The 111-day moving average sits around $85,600–$86,000, while the 350-day MA × 2 hovers near $198,943. No sign of overheating; the gap is still massive, keeping this far from euphoric territory.
In addition, valuation metrics echo the same tune. MVRV Z-Score, which flags over- or undervaluation against realized cost basis, clocks in at a subdued 0.45 as of writing. That’s reset territory after earlier extremes faded, historically a zone where demand tends to revive rather than collapse.
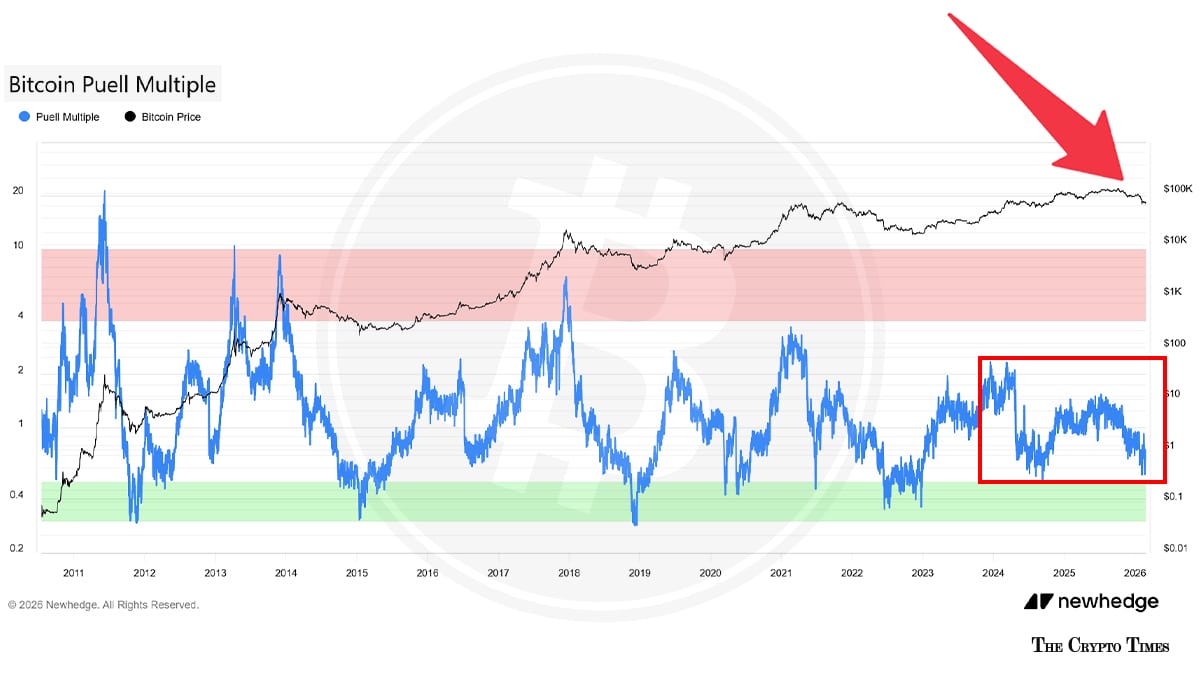
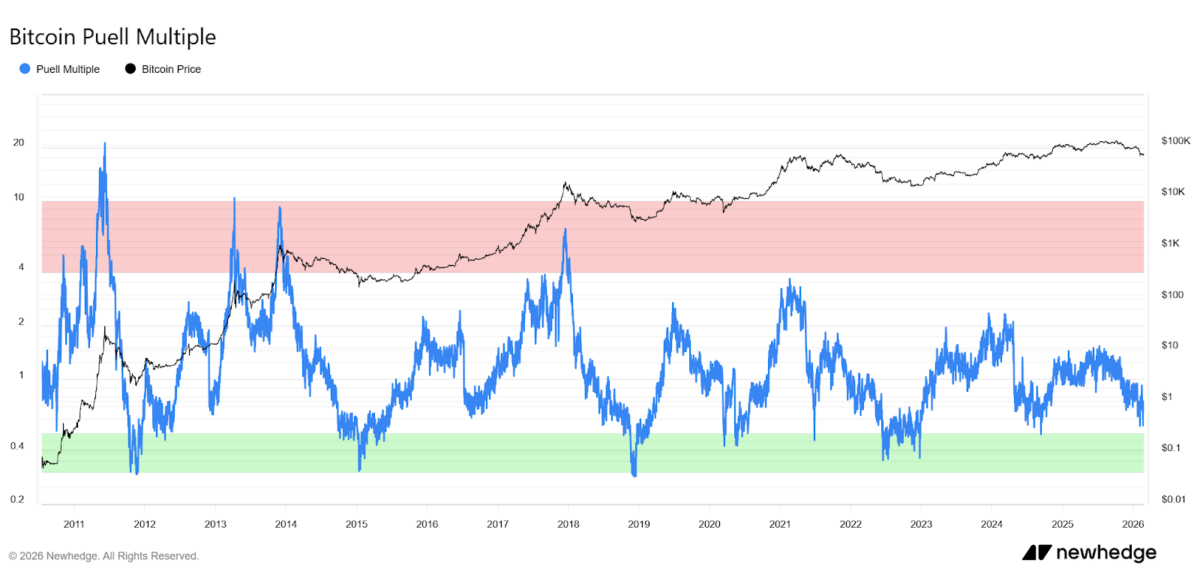
Meanwhile, Puell Multiple lingers around 0.66, well below the 2+ levels that scream tops and closer to capitulation ranges that have preceded major reversals. This metric tracks miner revenue against its yearly average.
For now, overhead resistance looms at $72,000 and higher, macro noise could flare up again, and volatility is baked in. But after the bloodletting earlier this year, this sudden $1 billion ETF grab and the cooling of classic top signals have traders whispering the same thing: maybe the worst is behind us, and the real accumulation phase is just getting started.
Also read: Fake Celebrity Profile Siphons ₹2.65 Crore in India’s New Crypto Scam