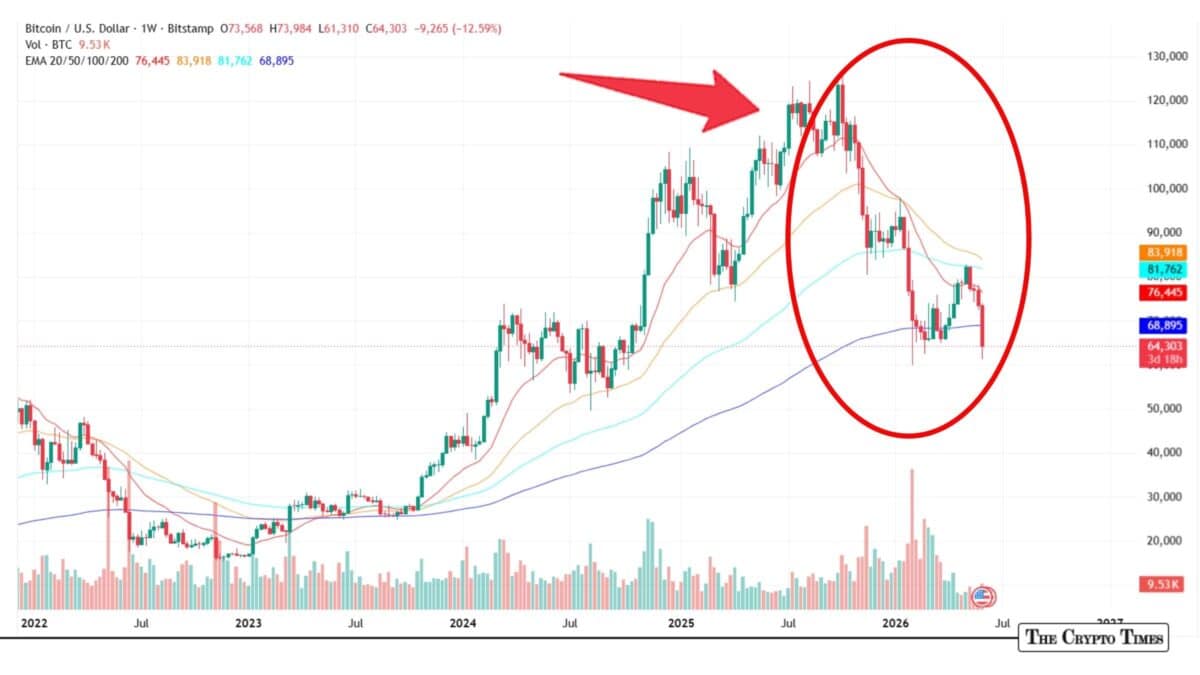
Bitcoin is enduring one of its sharpest corrections in the current market cycle. The cryptocurrency has plunged from intraday highs near $73,500–$74,000 earlier in the period, to testing lows around $61,350.
This marks nearly 50% drawdown from it’s all-time high of approximately $126,198 reached in October 2025. As of publishing, BTC trades around $64,300, down roughly 4.5% in the last 24 hours and over 12% on the week.
The current levels, hovering perilously near the 200-week EMA around $68,895, suggests a key long-term support level that has historically provided bounces in prior cycles.
What’s Driving the Sell-Off?
The latest decline below $62K follows several interconnected factors. Spot Bitcoin ETFs have recorded record outflows, with streaks exceeding 10–12 consecutive days and cumulative losses surpassing $5 billion in the last four weeks. This represents the largest monthly exodus of 2026 and signals waning institutional appetite.
Compounding the pressure, Strategy (formerly MicroStrategy) disclosed its first Bitcoin sale in years—32 BTC for about $2.5 million to cover dividends. Though small relative to its massive holdings, the move shattered the firm’s long-standing “never sell” narrative and rattled market confidence.
Moreover, broader macro conditions have not helped. Persistent inflation concerns, geopolitical tensions (including Middle East flare-ups), and capital rotation into AI and tech stocks have created a classic risk-off environment.
Sentiment Hits Rock Bottom
The Crypto Fear & Greed Index has plunged into Extreme Fear territory, registering readings as low as 20. Such deeply oversold conditions have historically preceded major relief rallies, though they can also signal further capitulation before a bottom forms. On-chain data shows whales and long-term holders trimming positions, adding to supply pressure.
Leveraged trading has dramatically intensified the sell-off. According to the latest CoinGlass data, over $1.61 billion in cryptocurrency positions were liquidated in the past 24 hours, with $1.36 billion in long positions wiped out compared to $257 million in shorts.
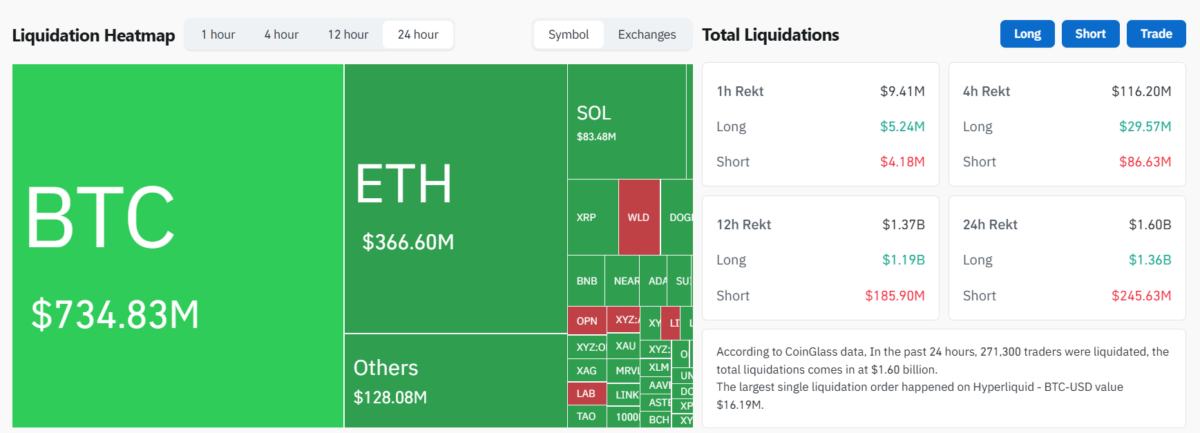
The 12-hour window showed even more extreme pressure, with $1.37 billion total rekt, including $1.18 billion in longs. A single large BTC liquidation order reached $16.19 million on Hyperliquid.
These cascades create a destructive feedback loop as falling prices trigger stop-losses and forced closures, driving prices even lower.
Technical Outlook and Key Levels
From a technical standpoint, Bitcoin has broken out of its recent consolidation range and entered a descending channel since late 2025.
The weekly chart paints a stark picture of capitulation. A strong red candle reflects heavy selling pressure, with Bitcoin breaking below multiple exponential moving averages (EMAs). The 20-week EMA sits at $76,445, the 50-week at $83,918, and the 100-week at $81,762—all now acting as overhead resistance.
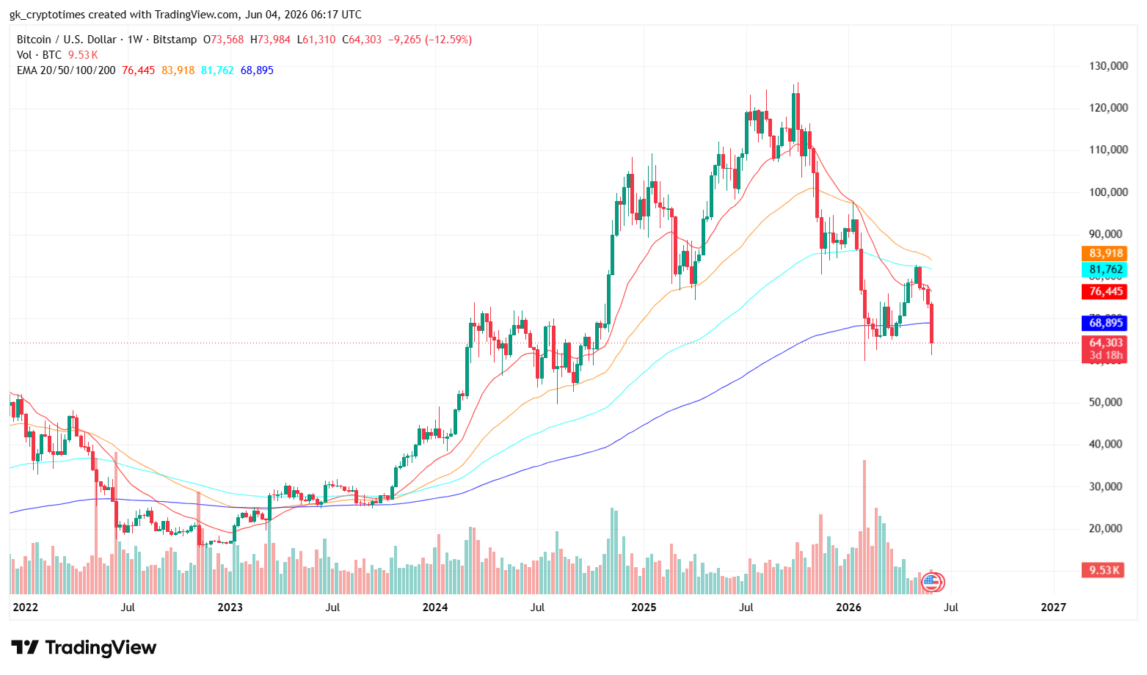
Immediate support lies at $61,000–$60,000, with deeper potential downside toward $58,000 if breached. A failure to reclaim $70,000–$73,000 soon could prolong the correction.
On the upside, reclaiming the 200-week EMA near $69,000 would be a first bullish step, followed by resistance at the EMA cluster around $76,000–$80,000.
The June 2026 sell-off represents a healthy, if painful, correction in Bitcoin’s maturation process. Extreme fear often marks inflection points, but further volatility is likely.
Also read: BitMine Issues 9.5% Series A Preferred Stock, Adopting MicroStrategy Model for Ethereum Treasury