
Key Highlights
- Ethereum traded at $2,669.20 as of 19:08 UTC on October 2 after climbing as high as $2,777.33 during the session.
- ETH remains inside the ascending channel that has guided its recovery since February, but price is now testing the lower side of that structure.
- The daily RSI has cooled to 58.86, leaving momentum positive but well below overbought territory.
- Spot Ethereum ETFs recorded $55.4 million in net outflows on October 1, extending their losing streak to three trading days.
- CryptoQuant says Binance ETH futures volume remains about 12.5 times larger than spot volume even after Ethereum’s 73% rebound, showing how heavily the market still depends on derivatives activity.
Ethereum (ETH) came within roughly $225 of $3,000 on October 2. By the end of the same daily session, the more immediate question had changed.
Can ETH stay above the trend that got it there?
ETH was trading around $2,683 on October 3 after opening the daily session near $2,669 and reaching an intraday high of about $2,688. The move follows a much more volatile October 2 session, when Ethereum climbed above $2,775 before reversing and closing near $2,669.
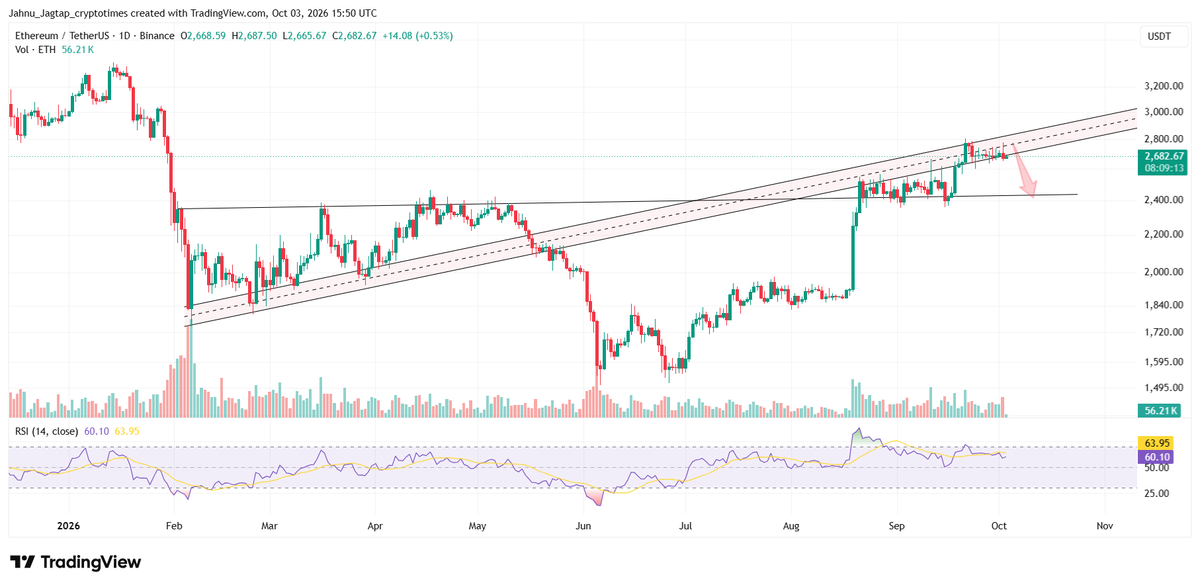
The rejection matters because it occurred close to the upper half of an ascending price channel that has contained much of Ethereum’s recovery during 2026. The first days of October is now a test of the rally rather than simply another attempt at $3,000.
ETH’s October chart is reaching a decision point
The daily chart tells a more interesting story than a simple resistance level at $2,800.
Ethereum’s ascending channel can be traced back to the February lows, when ETH was trading below $1,900. Price later broke sharply beneath the channel during the June selloff, bottoming near $1,500 before recovering through $2,000 and eventually reclaiming the structure in September.
ETH is now trading near the lower boundary of that same rising channel. That boundary sits around the mid-$2,600 region in early October and rises gradually as the month progresses.
For buyers, as long as Ethereum continues closing inside the channel, its sequence of higher lows remains intact and another attempt toward $2,800-$3,000 remains possible. A confirmed daily breakdown would create a very different October setup.
The next major horizontal area visible on the chart sits around $2,400-$2,450. That zone acted as resistance repeatedly earlier in 2026 before Ethereum finally broke through it in August and September.
A loss of the channel could therefore turn what currently looks like a shallow pullback into a retest of that former resistance.
Momentum has cooled without breaking down
Ethereum’s Relative Strength Index (RSI) adds another layer to the setup, the 14-day RSI stood at 60.10 on the October 2 chart. Its RSI moving average was higher at 63.95.
That is a noticeable change from September 21, when ETH’s rally above $2,700 pushed the RSI above 70 and into territory commonly viewed as overbought. The Crypto Times reported at the time that ETH had surged roughly 5% as increasing volume, futures positioning and short liquidations accelerated the breakout.
An RSI around 60 still leaves ETH above the neutral 50 level, but momentum is no longer accelerating with price. The RSI sitting below its own moving average also reflects some of the strength lost during the latest rejection.
That does not by itself signal a reversal, It does mean Ethereum would need renewed buying pressure if it is to move from another test of $2,800 into a sustained breakout.
September’s $2,800 Target Has Become October’s Resistance
There is useful continuity with Ethereum’s previous monthly setup.
At the start of September, The Crypto Times identified $2,800 as the bullish extension if ETH could first break through $2500 –$2510 and maintain momentum above $2,600 and $2,700. Most of that move has now happened.
ETH broke $2,500, cleared $2,600 and traded repeatedly above $2,700. On October 2, it reached $2,777.33. But it still has not established itself above $2,800. That turns the old upside target into the most important resistance area for October.
A clean move above roughly $2,775 –2,800 would put ETH beyond the recent rejection zone and toward the upper portion of its ascending channel. Depending on when that breakout occurs, the channel itself points toward roughly $2950 $3100 later in the month.
That makes $3,000 technically reachable without requiring Ethereum to leave its existing trend.
The bullish case therefore does not need a new parabolic move. It needs ETH to stay inside the channel and finish the breakout it failed to complete in September.
Futures still dominate Ethereum trading
A recent CryptoQuant analysis found that Ethereum had risen about 73% during the period examined, while trading activity on Binance remained overwhelmingly concentrated in derivatives.

Binance ETH futures volume was still roughly 12.5 times larger than spot volume, according to the analysis.
That imbalance matters because futures-led rallies can move quickly without necessarily representing an equivalent increase in underlying spot demand.
The issue is not that futures activity is inherently bearish. Derivatives are a major part of crypto price discovery.
The concern is how much of ETH’s latest move is being driven by leveraged positioning.
A rally supported by rising spot purchases would generally provide stronger evidence that investors are accumulating the underlying asset. A market where futures volume overwhelms spot volume is more vulnerable to sharp repositioning when price moves against leveraged traders.
That risk is especially relevant while ETH sits close to the bottom of its rising channel.
Open Interest Is Rising, Not Disappearing
CoinGlass data reinforces that derivatives remain central to the market, as Ethereum futures open interest is around the mid-$30 billion range at the beginning of October.
Open interest fell sharply during the first half of 2026, moving from roughly $40 billion in January toward the low-$20 billion region around June. It then rebuilt alongside Ethereum’s price recovery through August and September.
By early October, outstanding futures positions were again approaching the mid-$30 billion area. That means traders have been adding exposure as ETH recovered. It also changes how the current channel test should be interpreted.
If Ethereum breaks higher through $2,800 while open interest continues rising, the market could gain additional momentum as traders build positions around the breakout.
But a breakdown through the lower channel while a large amount of futures exposure remains outstanding can work in reverse. Leveraged longs may be forced to reduce positions, potentially accelerating a move that begins as an ordinary technical correction.
This is why the $2,600-$2,650 region carries more significance than a normal support line.
ETF Investors Are Moving the Other Way
While futures activity remains elevated, the U.S. spot ETF market has weakened. Spot Ethereum ETFs recorded $55.4 million in net outflows on October 1, according to Farside Investors. The losses followed $59.6 million of outflows on September 30 and $2.8 million on September 29.
That brings the three-session net outflow to about $117.8 million. The funds took in $270 million on September 21, $162.2 million on September 22 and $104.5 million on September 23. Another $87 million entered on September 25 before inflows slowed to $17.1 million on September 28. Farside Investors
Institutional fund demand was strong during the move through $2,700, then faded as ETH approached the upper end of its recent range. Now Ethereum is attempting to defend its trend while ETF flows have turned negative for three consecutive sessions.
That does not establish a lasting exodus from ETH funds, but a return to sustained inflows would make a renewed $2,800 breakout more convincing.
Further outflows would deepen the contrast between leveraged futures activity and weaker ETF demand.
October 6 Brings Ethereum’s First Network Test
There is also one catalyst this month that has little to do with Bitcoin, the Federal Reserve or derivatives positioning.
Ethereum’s Glamsterdam upgrade is scheduled to activate on the Sepolia testnet on October 6 at 13:53:36 UTC.
Glamsterdam combines changes to Ethereum’s execution and consensus layers. Its headline features include enshrined proposer-builder separation and block-level access lists, alongside changes to gas pricing intended to help Ethereum increase Layer-1 throughput.
Ethereum developers have not yet set dates for Hoodi or mainnet deployment. That limits the case for treating the Sepolia fork as an automatic price catalyst.
Still, it gives ETH an Ethereum-specific event during a month otherwise dominated by whether the market can sustain September’s recovery.
Can Ethereum Reach $3,000 in October?
The latest chart makes $3,000 plausible, but it also makes the route there much clearer. Ethereum does not first need to conquer $3,000. It needs to defend roughly $2,650, remain inside its rising channel and break the $2,775 –$2800 area that has repeatedly stopped the recovery.
Above that region, the upper half of the channel moves toward $2,900 and eventually $3000 –$3100 during October. From $2,669.20, reaching $3,000 would require a gain of about 12.4%.
That is well within the range of moves ETH has already produced during the current recovery, the risk is what happens before that move begins.
ETF flows have reversed. Futures still dominate spot activity on Binance. Open interest has rebuilt to the mid-$30 billion area. ETH has just declined from $2,777 while its daily RSI has cooled below its own signal line.
None of those factors has broken the trend yet.
A sustained move beneath the lower channel would weaken the October bullish structure and put roughly $2400 –$2,450 back into focus — the same region Ethereum spent months trying to escape earlier this year.
If buyers defend the channel instead, another $2,800 test would leave $3,000 much closer than it looked at the beginning of September.
For October, the real Ethereum price prediction is therefore not simply “$3,000.”
It is whether the rising structure that carried ETH from below $2,000 can survive its first serious test near $2,650.
Ethereum Price Prediction for October 2026
| October setup | Price area | What would need to happen |
|---|---|---|
| Channel holds | $2,650-$3,050 | ETH defends the rising trend line and breaks through the $2,775–2,800 area |
| Consolidation | $2,500-$2,800 | Buyers defend the broader recovery but ETH continues failing near the September highs |
| Channel breaks | $2,400-$2,500 | ETH loses the lower trend line and selling expands toward the former breakout zone |
Also Read: Vitalik Buterin Says Ethereum Is Becoming a Cryptographic World Computer