Chainlink (LINK) is trading near $14.40 as of early October, 2026, with a market capitalization of about $10.8 billion and a circulating supply close to 748 million tokens. The fixed cap is 1 billion.
The token sits roughly 73% below its May 2021 all-time high of about $52.70, and about 35% below its level of a year earlier, when it traded above $22. Over the past month it has recovered roughly 30% from prices near $11. That mix — a hard cap, a live institutional product cycle, and a reserve that converts revenue into LINK — is what the bands below try to price. The ranges are scenario analysis, not targets.
What is Chainlink (LINK)
Chainlink runs a decentralized oracle network that brings external data into smart contracts, and it has extended that role into cross-chain messaging, compliance checks and reserve attestations. LINK is the asset used to pay for parts of that stack, and the asset into which a portion of enterprise and onchain revenue is converted. Holders do not have a contractual claim on fees. Price still depends on adoption, fee growth and the multiple the market applies to both.
The project describes the conversion mechanic in its August 2025 note on the Chainlink Reserve. Offchain enterprise payments and onchain service fees can be swapped into LINK and parked in the reserve. Chainlink said it did not expect withdrawals for multiple years. The reserve dashboard showed about 6.12 million LINK in early October 2026, valued near $88.8 million, with an average cost basis around $11.21. Weekly inflows late in the quarter ran from roughly 75,000 to about 140,000 LINK. That is a real sink. It is also under 1% of circulating supply.
How These Scenarios Were Built
The bands below are not model outputs from a single screen. They combine three inputs: where LINK trades now, what Chainlink has actually shipped, and the distance between flat statistical forecasts and the best-known institutional path. Standard Chartered’s August 10, 2026 initiation, written by Geoff Kendrick, put LINK at $13 by the end of 2026, $41 in 2027, $82 in 2028, $133 in 2029, and $200 by the end of 2030, on a view that tokenized assets on public chains could reach about $4 trillion by the end of 2028. Spot LINK is already above the bank’s 2026 marker. The later rungs are the bull case, not the base case. Screen-level models updated on October 2 mostly keep averages in the teens to low 30s even out to 2030. The table uses that spread instead of picking one number.
| Horizon | Bear | Base | Bull | What the band implies |
|---|---|---|---|---|
| Remainder of 2026 | 9–12 | 13–18 | 20–27 | A held range around the current print, or a retest of the September base |
| 2027 | 8–14 | 18–30 | 35–45 | Pilots turn into recurring usage, or the 2026 rebound fades |
| 2028–2029 | 10–18 | 28–50 | 70–130 | Tokenized settlement becomes a real fee line, or stays a pilot |
| 2030 | 12–25 | 40–70 | 100–200 | Chainlink is core market infrastructure, or one vendor among several |
Weekly Setup: A $10.8 Billion Oracle Token Below the 2021 High
LINK enters October just under the mid-teens area that capped the late-September push. The session on October 2 ranged from about $14.16 to $14.65. The 52-week range is about $7.19 to $23.37. Nothing in that setup requires a new all-time high this year. It does require a decision on whether $15.80 is a ceiling.
The fundamental tape is busier than the chart. On September 28, Chainlink said CCIP 2.0 was live for institutions and digital-asset issuers. The upgrade adds opt-in Cross-Chain Verifiers, faster-than-finality transfers, modular fees and native policy checks, while leaving the default decentralized oracle network and full-finality path in place.
Chainlink said the system had secured more than $84 billion in cross-chain token value, with more than $15 billion migrating to it in the prior four months, including BitGo’s WBTC, Coinbase’s cbBTC, Kraken’s kBTC, and Wyoming’s FRNT. Two days later it introduced Fulcrum, a cross-chain repo workflow demonstrated with DTCC at Sibos.
On September 22 it announced a partnership with Infosys covering the same stack. Each item is a distribution or product fact. None is a disclosed fee total.
Chainlink (LINK) Technical Analysis
Price is above the 50-day average near $12 and the 200-day average near $9.50, with a 14-day relative strength index around neutral-to-firm on aggregated readings. That is a recovered chart, not an extended one. The level that matters first is $15.80. A daily close through it would put $18 and $20 in view, and $23.37 — the 52-week high — behind them.
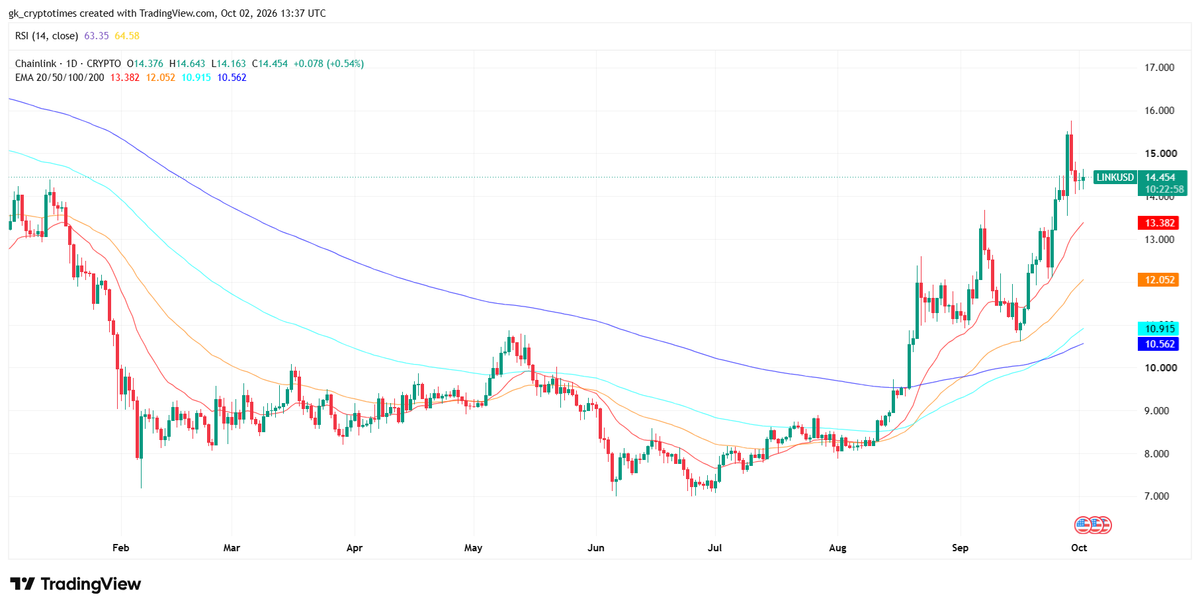
A daily close below about $13.50 would break the October shelf and put the early-September base near $11 back on the chart. The 2026 trough near $7.19 is the larger bear reference, not the default October path.
Chainlink’s own CCIP fee schedule is the reason technical levels and notional value can diverge. Many transfers are priced as flat charges of well under two dollars, or as small add-ons set by token-pool owners. A network can secure tens of billions in token value and still collect modest verification revenue. Traders pricing a break of $15.80 are pricing follow-through, not the headline secured-value figure.
Chainlink (LINK) Price Prediction 2026
One quarter of 2026 is left. The base case for year-end is 13–18, a band around the current $14.40 print. That range assumes the September product cycle neither fails nor turns into a second leg of institutional headlines before year-end. The bear band of 9–12 would fit a broad crypto drawdown that unwinds the move from about $8 in early August. The bull band of 20–27 would require a held break of $15.80 and at least one production proof point — a further CCIP migration, a Fulcrum financing outside a conference, or a visible step-up in reserve inflows.
The CCIP 2.0 launch is already in the price to some degree. LINK rose toward $14.81 on the day of the announcement and has since consolidated. A clean integration does not automatically raise the token. A quiet fourth quarter can still cap the bull case, because the market has started to discount “institutions later.”
Chainlink (LINK) Price Prediction 2027
The 2027 base band is 18–30. It assumes CCIP 2.0’s opt-in verifiers and compliance checks move from availability to named use, and that the DTCC Collateral AppChain, which Chainlink has placed in the first quarter of 2027, produces a workflow rather than another demonstration. The Fulcrum launch is the relevant product. It separates the financing venue from the chains where cash and collateral settle, and it does not take custody. A live repo book would support the middle of this band. A slipped timetable would not.
The bear band of 8–14 is the 2026 range revisited: pilots stay pilots, and LINK trades as a beta asset. The bull band of 35–45 overlaps the Standard Chartered 2027 rung of $41. Reaching it requires fee growth, not just secured value. Flat CCIP charges do not get there on volume alone unless enterprise offchain payments, converted through the reserve, scale with the client list.
Chainlink (Link) Price Prediction 2028 and 2029
These two years are where the institutional thesis either becomes a fee line or stays a partnership list. The base band of 28–50 assumes tokenized funds and financing use Chainlink data, messaging, and compliance often enough that reserve inflows are no longer a rounding error against circulating supply. The bear band of 10–18 assumes competition and slow tokenization leave LINK inside an expanded version of today’s range. The bull band of 70–130 is the zone in which the bank’s 2028 and 2029 rungs of $82 and $133 would stop looking like outliers.
The Infosys partnership belongs in this window more than in the 2026 window. Chainlink’s September 22 post said Infosys supports banking and payments infrastructure for more than 1.7 billion customer accounts, and that the work covers CCIP, the runtime environment, the compliance engine, Proof of Reserve and data products. That is a distribution path. It is not a deposit migration. By 2028 the market will be able to see whether any of those accounts touch the stack.
Chainlink (Link) Price Prediction 2030
The 2030 base band is 40–70. It treats Chainlink as established market infrastructure with a modest multiple on a larger fee base, not as a 14-fold rerating from today’s price. The bear band of 12–25 is the outcome if oracle and interoperability demand fragments across specialists and in-house verifiers. The bull band of 100–200 is the Standard Chartered end-point and the area around it. It requires the bank’s volume path — tokenized assets near $4 trillion by 2028, and a related rise in DeFi assets — and a stable link between fees and the token. Chainlink’s own risk set for that call, as described from the note, is the right one: slower institutional tokenization, competition, and technical or configuration failures.
A $200 print on a 1 billion cap is a $200 billion fully diluted value. That is a large infrastructure multiple. It is not impossible if the rails thesis holds. It is not the center of the distribution.
What Would Push the Coin From One Band to Another
Toward the bull band
- Named production use of CCIP 2.0 verifiers and compliance checks, beyond the secured-value figures already published.
- A Fulcrum financing that settles outside Sibos, and a DTCC appchain that launches on the stated 2027 timetable.
- Reserve inflows that step up from the current weekly pace of roughly 75,000 to 140,000 LINK.
- A broader crypto market that keeps supporting large-cap infrastructure tokens.
Toward the bear band
- A risk-off turn that compresses Bitcoin and Ethereum, which LINK has historically amplified.
- CCIP and Fulcrum remaining at the demonstration stage through 2027.
- Issuers using their own verifiers and treating the public network as a fallback, so notional value rises and fees do not.
- Competition from other oracle or messaging systems that takes share of tokenized-fund data.
What probably does not decide the band by itself
- The $84 billion secured-value headline, unless fees move with it.
- A single partnership announcement, including Infosys, without a named client workflow.
- Screen-model averages that damp historical drift and ignore the product cycle.
- The 2030 bank target, which is a scenario attached to a research note, not a near-term input.
Bottom Line
LINK near $14.40 already prices a partial recovery and the first response to CCIP 2.0. The rest of 2026 is a range decision around $13.50 and $15.80. The 2027–2030 bands widen because the fee link is still unproven: the reserve is real, the cap is real, and the institutional client list is real, while the take-rate on cross-chain value is still small. A move through the bull bands, including $200 by 2030, requires tokenization volumes and fee conversion that are not in the current billing schedule. A drift inside the bear bands requires those volumes to disappoint. The base path sits between them.
This article is for information only and is not investment, legal, or tax advice. The ranges above are scenario analysis, not guarantees. Cryptocurrency prices are volatile. Do your own research and consider speaking with a licensed adviser before risking capital.
Also read: XRP Price Prediction October 2026: Can XRP Rally Towards $2?