
Bitcoin traded near $84,000 on Thursday (7:00 AM UTC), September 23, after reclaiming a zone last held in late January and briefly printing above $87,000 earlier this week.
The move has pulled the broader digital-asset market back toward the $3 trillion mark and reversed a mid-September slide that had taken Bitcoin into the mid-$70,000s. The rebound is visible on the attached 1 month chart from TradingView. The more useful question is what actually funded it.
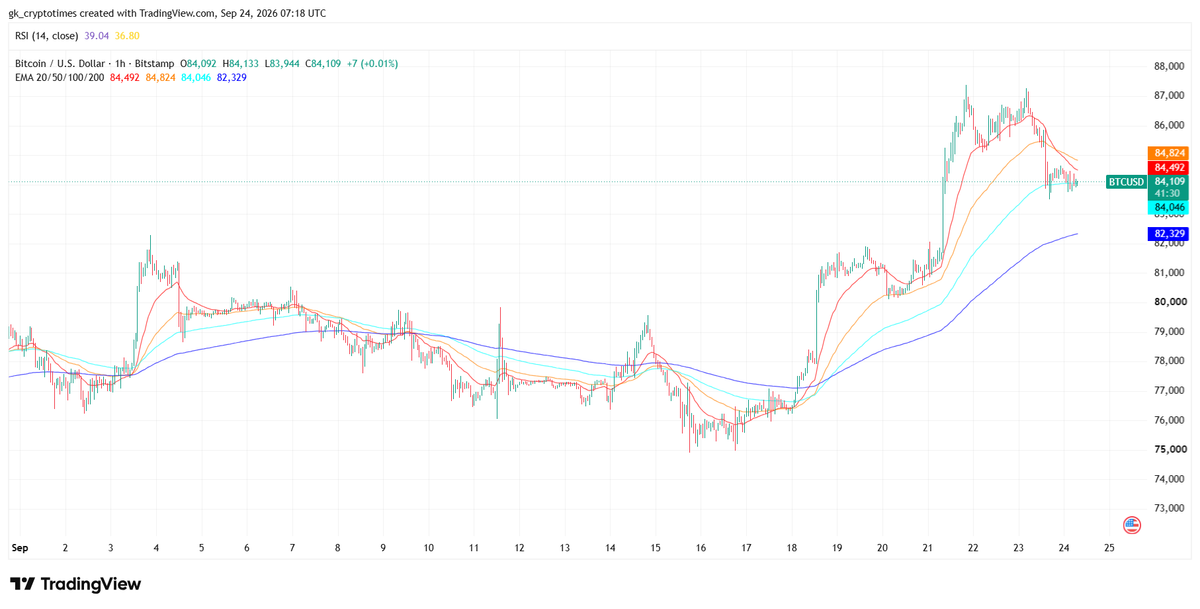
This month’s tape is a mix of documented fund flows, forced buying in derivatives, small corporate treasury purchases, and a policy backdrop that looked hostile on paper. U.S. spot Bitcoin exchange-traded funds swung from hundreds of millions of dollars in redemptions around September 15–16 to more than $2 billion in creations across September 18, 21 and 22.
What follows is a closer look at September’s sequence—the documented fund flows, the policy backdrop that looked hostile on paper, the derivatives book that amplified the move, the on-chain and corporate prints that sat underneath it, and the tests still sitting on the tape. The aim is to keep the record checkable and the claims no larger than the evidence.
ETF creations reverse a mid-month drain
The cleanest institutional print sits in the U.S. spot Bitcoin exchange-traded funds. Farside Investors recorded a net inflow of nearly $1 billion on September 21, with BlackRock’s IBIT at $381.4 million, ARK 21Shares’ ARKB at $289.1 million and Fidelity’s FBTC at $238.8 million. No major product printed a net outflow that session. The same table shows $433.0 million on September 18 and $714.7 million on September 22, taking the three-session total above $2.1 billion.
SoSoValue published matching session totals of $998.95 million on September 21 and $714.75 million on September 22. As of the September 22 update, the dashboard listed about $110.84 billion in net assets across the U.S. spot Bitcoin complex and cumulative net inflows of roughly $56.87 billion. Those figures describe fund creations and redemptions, not secondary-market trading volume. They also sit against a mid-month drain: Farside logged $450.4 million in outflows on September 15 and $295.9 million on September 16.
The sequence matters for how the rally should be read. Capital left the products around the Senate procedural vote and the Federal Reserve decision, then returned in size after Bitcoin reclaimed the $80,000–$82,000 area.
Whether Monday’s $999 million print was new allocation, delayed Friday activity, or both cannot be settled from the daily table alone. What the table does show is that the largest products absorbed most of the creations and that the flow swing was large enough to coincide with the first print above $87,000 since January.
Policy headwinds did not halt the rebound
The price recovery arrived after two events that many traders had treated as near-term negatives. On September 15, the Senate failed to invoke cloture on the motion to proceed to H.R. 3633, the Digital Asset Market Clarity Act. The Senate Daily Press recorded the vote at 49–50. Cloture on a motion to proceed requires 60 votes. The bill remains on the calendar, and a motion to reconsider was entered, but the floor test did not open debate.
The next day, the Federal Open Market Committee raised the federal funds target range by a quarter point to 3-3/4 to 4%. The FOMC statement said economic activity was expanding at a solid pace, inflation remained elevated, and the action was intended to support a timelier return to the 2% inflation goal. The vote was 12–0.
A separate policy change from August is still part of the market backdrop. On August 19 the U.S. Treasury said it would increase, by at least double, the size of liquidity-support buybacks of longer-dated nominal coupon securities, lifting the prior $2 billion maximum to at least $4 billion per operation from September 9 through November 4. The Treasury announcement framed the change as liquidity support in sectors that had drawn large volumes of high-quality offers, not as a change in deficit policy or auction sizes.
Those three items—failed cloture, a rate increase, and larger long-end buybacks—do not form a single causal story. They do explain why the September 15–16 ETF outflows were unsurprising and why the subsequent rebound has been described as flow-driven rather than event-driven. Bitcoin’s move higher after a tightening decision and a legislative setback is a fact on the chart. It is not proof that regulation or rates have become irrelevant.
Short covering and a heavier derivatives book
Derivatives positioning amplified the spot move. Market data firms tracking perpetual futures reported large liquidations as Bitcoin broke above $84,000–$85,000, with short positions accounting for the bulk of the forced buying. Open interest across crypto perpetual futures has also risen toward levels last seen in late October 2025, near $160 billion on widely cited Coinglass aggregates.
That combination—spot ETF creations plus short covering—can produce a fast advance that looks stronger than the underlying change in cash demand. Several desks have noted that Bitcoin’s open interest did not explode in lockstep with price, which argues against an extreme leverage blow-off. Others have warned that if open interest and funding rates accelerate faster than spot buying, the risk of a sharp pullback rises.
The distinction is practical. ETF creations remove Bitcoin from the tradable float when authorized participants deliver coins against new shares. Short covering is a closing of existing bets. Both can lift price in the same session. Only the first adds a more persistent bid unless redemptions later reverse it. The September 21–22 flow tables show the first. Liquidation prints show the second. Neither, by itself, guarantees that $87,000 becomes a base rather than a high-water mark.
On-chain signals and corporate treasury buying
On-chain research has treated the reclaim of a long moving average as more than a chart curiosity. In a September 22 note, CryptoQuant said Bitcoin had crossed above its 365-day moving average near $80,500 and was trading around $86,000. The firm described that crossover as the signal that marked bull markets in 2019 and 2023 and bear markets at the end of 2021 and in November 2025. It also said its Bull Score Index and cycle indicator had already flipped toward an early bull phase in mid-August, and that price had moved through a $76,000–$81,000 supply cluster associated with older coins sold earlier this year.
Though that is a research conclusion, not a forecast. CryptoQuant itself noted that pullbacks inside a young bull market remain normal and pointed to $88,000–$90,000 as the next supply zone. The 200-day average near $70,600 was cited as lower support.
Corporate treasuries added a smaller, documented bid. Strategy Inc. reported in a Form 8-K dated September 21 that it purchased 950 bitcoin between September 14 and September 20 for $75.7 million, or $79,670 a coin including fees, lifting holdings to 846,000 bitcoin acquired for $63.80 billion at an average cost of $75,416. The company said the coins were bought with USD cash and that it sold no shares under its at-the-market program in that window.
Nine hundred fifty coins is modest next to a $999 million ETF day. It is still a cash-funded addition from the largest public bitcoin treasury and part of the bid stack that sat under the rebound.
Market-cap recovery and the tests still ahead
CoinGecko and other market-cap trackers showed the total crypto market moving back through or around $3 trillion as Bitcoin traded in the mid-$80,000s, a threshold last held in January. Bitcoin’s own capitalization is near $1.7 trillion. Ether, Solana, XRP and several large-cap tokens participated, though bitcoin dominance has remained elevated near 57%, which argues that the rebound is still bitcoin-led rather than a confirmed altcoin season.
The year-to-date picture is less dramatic than the weekly tape. Bitcoin opened 2026 near $87,500 and is now close to that level after trading as low as the high $50,000s earlier in the year. The October 2025 record above $126,000 remains far overhead. A weekly gain of roughly 13–14% can look like a regime change and still leave the asset little changed on the calendar year.
The next tests are straightforward. ETF flow tables from Farside and SoSoValue will show whether creations persist after the squeeze fades. Perpetual open interest and funding will show whether leverage is rebuilding faster than cash demand. The 365-day average near $80,500 is now a reference that bulls will defend and bears will attack. Resistance into $88,000–$90,000 is the zone CryptoQuant flagged as the next supply wall.
None of that requires a narrative about “crypto winter” ending. The documented facts are narrower. Spot Bitcoin ETFs swung from hundreds of millions in redemptions to more than $2 billion in creations across a handful of sessions. Bitcoin printed above $87,000 for the first time since January.
Now if these catalysts will remain hot over the next quarter will depend on whether the bid that showed up in the ETF tape stays there after the shorts have finished covering and a mild profit-taking takes place.
Also read: Liquid Network Exploit Explained: Unbacked L-BTC and the $320M Peg-Out