
Key Highlights
- BNB reached $806.53 on September 21 after trading as low as $538.60 during the past three months, before closing September 29 around $756.
- The daily chart shows a broad double-bottom structure, with the 700-720 region acting as the neckline and now emerging as support.
- TradingView’s one-day technical summary remains on Buy and moving averages show Strong Buy, but MACD and Momentum have shifted to Sell.
- BNB Smart Chain holds about $5.7 billion in DeFi TVL, $13.3 billion in stablecoins and $4.8 billion in active RWA assets.
- BNB futures open interest remains around $1.3 billion, leaving leverage capable of accelerating either a breakout above $806 or another rejection.
BNB is heading into October within striking distance of its September high, but getting above $800 has so far proved easier than staying there. The token climbed to $806.53 this month before pulling back toward $760 on September 29, leaving it near the upper end of a 90-day range that stretches down to $538.60, according to CoinMarketCap.
On September 29, BNB opened at $763.96, climbed to $769.33, fell as low as $750.47 and was trading around $756.21 on the daily Binance chart. That still leaves the token far above the lows seen earlier in the year and, more importantly, above a breakout area that has been developing for months.
The larger chart now matters as much as the September high. BNB’s recovery through 2026 has formed a broad double-bottom pattern, with one major trough during the February-March decline and another around June-July. The rebound between those lows topped out around the $700-$720 region, creating a neckline that BNB eventually broke during its August-September rally.
That makes October less about whether BNB can recover and more about whether it can hold the breakout it has already made.
BNB Double Bottom Keeps $850–900 in View
The most important feature on BNB’s daily chart is the W-shaped recovery that developed across the first half of 2026.
The first bottom formed after BNB fell sharply into the mid-$500s during February and March. The token subsequently recovered toward roughly $700 before selling off again into June and July, when it formed another major low around the same broad area.
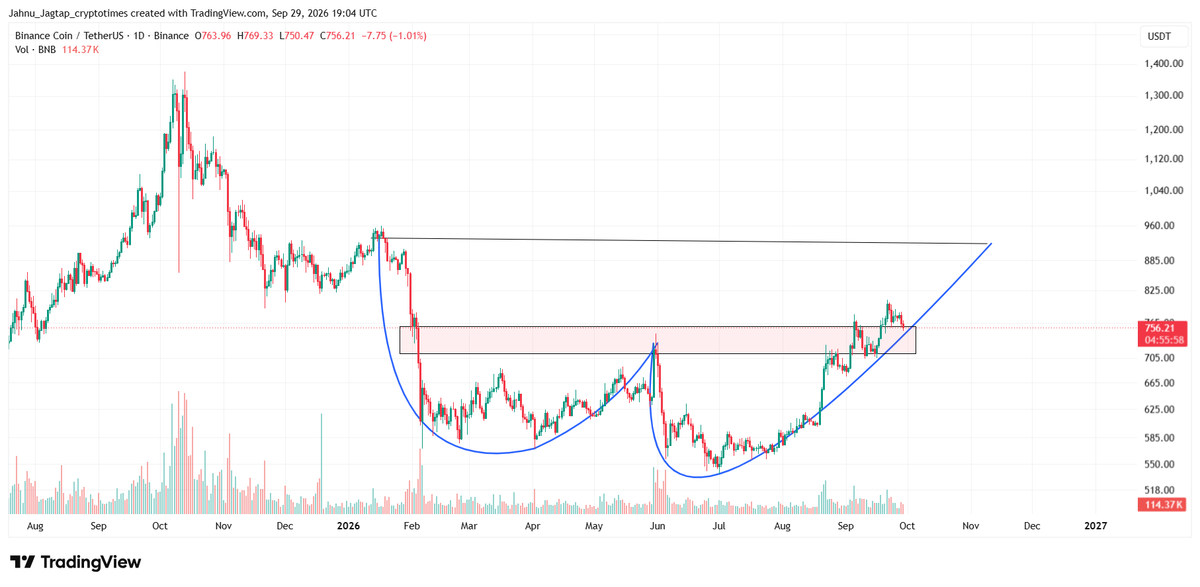
BNB then began a much stronger recovery from the second trough, eventually moving through the $700-$720 region and reaching above $800 in September.
That $700-$720 area is important because it acted as the neckline of the double bottom before the breakout. It is now being tested from the other side as support.
The measured move from the pattern also helps explain why $850-$900 has become relevant. With the bottoms forming around the mid-$500s and the neckline close to $700-$720, the depth of the pattern is roughly $150-$170. Projecting that distance above the neckline produces an area around $850-$890.
That overlaps closely with the larger resistance visible on the daily chart around $900-$920.
The pattern does not guarantee that BNB will reach those levels. A sustained fall back below the neckline would weaken the breakout considerably. But as long as BNB holds above the $700-$720 area, the double bottom remains an important part of the bullish October case.
BNB Enters October After a Sharp Three-Month Recovery
According to CoinMarketCap, the token’s 90-day range between $538.60 and $806.53, with BNB still near the upper end of that band despite the pullback. Historical data also shows how quickly the September rally developed. BNB traded as low as $704.42 on September 16, rose to $735.07 by September 18 and reached $806.53 on September 21.
Trading volume expanded with the move, crossing over $2.7 billion in BNB volume on September 21, compared with roughly $1.5 billion on September 16. Market capitalization reached about $106.4 billion at the September high before falling back toward $101 billion by September 29.
That makes October less about whether BNB can stage a recovery and more about whether the recovery can extend.
The first attempt stalled at $806.53. If buyers push through that high again and can keep BNB above $800, there is relatively little recent price structure between the September peak and the next psychological areas around $825 and $850.
But the same rally that brought $850 within reach has also left BNB much further from the support that formed earlier in September. A move below $740 would bring $720 back into focus, while the 700-705 area marks the region from which the strongest part of the September advance began.
BNB Price Prediction October 2026
| Scenario | October range | What could drive it |
|---|---|---|
| Extended rally | $850-$900 | BNB holds above $807, Bitcoin strengthens and BSC liquidity expands |
| Bullish | $807-$850 | BNB clears the September high and holds above $800 |
| Consolidation | $740-$807 | Buyers defend the September rally but fail to clear the high |
| Bearish | $700-$740 | BNB loses the mid-$700s as crypto markets weaken |
| Deeper correction | $680-$700 | Bitcoin falls sharply and leveraged BNB longs unwind |
Daily Indicators Show a Stronger Trend Than Momentum
BNB’s daily chart still points to a broader uptrend heading into October, even though the latest price action shows that the September rally has started to lose momentum.
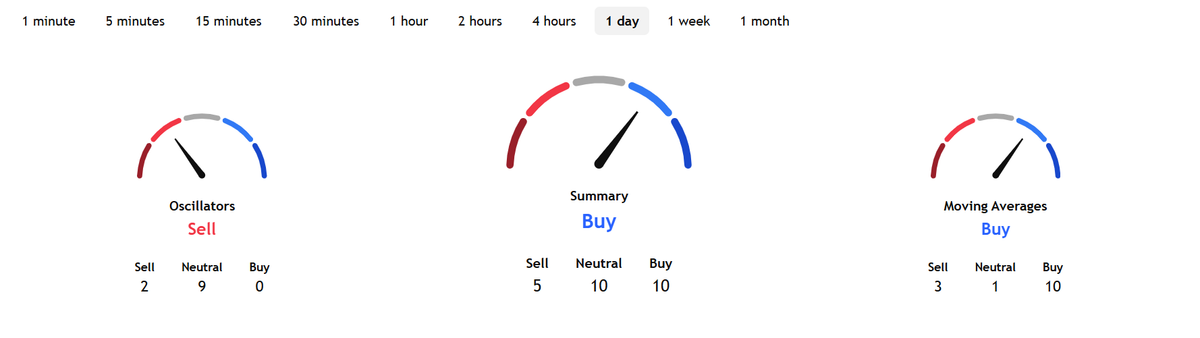
TradingView’s one-day technical summary still gives BNB an overall Buy reading, helped largely by the strength of its moving averages. The token remains above most of its medium- and long-term averages, including the 20-day, 30-day, 50-day, 100-day and 200-day measures. That suggests the broader recovery from the summer lows is still intact despite the pullback from above $800.
The shorter-term picture is less convincing. BNB has slipped below its 10-day moving averages, while two momentum indicators have turned negative. The Moving Average Convergence Divergence, which tracks changes in trend strength, is showing a Sell signal, and the Momentum indicator is also negative. Both point to weaker buying pressure compared with the earlier part of the September rally.
Other indicators are more neutral. BNB’s 14-day Relative Strength Index stands at 54, placing the token near the middle of its usual range rather than in overbought or oversold territory. The Stochastic oscillator is at 60, while the Commodity Channel Index remains close to neutral. The Average Directional Index, which measures the strength of a trend rather than its direction, sits at 32, suggesting the broader move still has some strength behind it.
Taken together, the readings show a market that has not yet lost its bullish structure, but is no longer accelerating at the same pace.
That makes the September high around $806-$807 more important. A sustained move above that area would suggest buyers are regaining control and could reopen the path toward $850. Another rejection, especially if momentum continues to weaken, would increase the chances of BNB spending more time consolidating above the $700-$720 breakout zone.
The $800 Question
Round numbers often attract attention in crypto, but $800 matters for BNB for a more practical reason: sellers have already appeared there.
BNB reached $806.53 on September 21 and closed the session at $798.89. The following day, the token again traded as high as $799.53 before falling back, according to CoinMarketCap’s historical data.
That leaves a clear concentration of resistance between $800 and $807.
If BNB moves through that area and remains there, $825 would be the first relatively modest extension. A move toward $850 would require a gain of roughly 12% from prices around $760, while $900 would require an advance of close to 19%.
The alternative is a month of consolidation. BNB does not need to reach $850 for the September recovery to remain intact. Spending October between roughly $740 and $807 would still leave the token well above the levels seen earlier in the quarter.
The picture becomes less comfortable below $740. A sustained break would expose $720 and then $700, where buyers would need to defend much more of the September advance.
BNB Futures Open Interest Stays Above $1 Billion
The next test of $800 will also take place with a large derivatives market sitting behind the token.
CoinGlass shows around $1.30 billion in BNB futures open interest, compared with a market capitalization of roughly $101 billion. Futures volume was about $730 million over 24 hours in the latest reading, while spot volume on the exchanges tracked by CoinGlass was closer to $135 million.
That gap leaves leverage capable of adding force in either direction.
If BNB moves through $806 while short positions remain exposed, liquidations could help accelerate the rally. Another rejection near $800 could produce the opposite effect if leveraged longs built during September begin to unwind.
A breakout supported by stronger spot buying would therefore look very different from a short-lived move driven mainly by futures activity.
BNB Chain Has $13.3 Billion in Stablecoins and $4.8 Billion in RWA Assets
BNB’s price recovery is taking place on a network that still carries substantial amounts of capital.
BNB Smart Chain has about $5.70 billion locked across DeFi protocols and $13.32 billion in stablecoins, according to DefiLlama. Stablecoin supply is up only around 0.3% over the past week and down 0.4% over the past 30 days, however, suggesting that liquidity has been relatively stable rather than expanding rapidly.
The chain also has about $4.84 billion in active real-world asset AUM, giving BNB Chain a sizeable position in one of the fastest-growing parts of the on-chain market.
CryptoTimes has tracked that expansion throughout September. An earlier report found BNB Chain hosting around $1 billion of tokenized stocks, accounting for 32.7% of the $3.1 billion market measured at the time.
A later CryptoTimes report also placed BNB Chain among the largest networks for tokenized real-world assets.
That gives BNB Chain another source of activity beyond conventional DeFi and trading, particularly as tokenized stocks, funds and other financial assets continue moving on-chain.
BSC Activity Is High, but DEX Volume Has Cooled
The user side of the network remains large. DefiLlama recorded about 2.16 million active addresses and more than 417,000 new addresses over the latest 24-hour period, while BSC processed around 17.36 million transactions.
Decentralized exchanges handled roughly $952 million in 24-hour volume and $5.71 billion over seven days.
But the weekly number is moving in the opposite direction to BNB’s September price rally. Seven-day DEX volume is down about 25.2%, while perpetual DEX volume has fallen around 32.7% over the same period.
Applications on BSC generated around $2.69 million in fees over 24 hours, while chain-level fees were about $475,000. App revenue stood around $875,000, with chain revenue near $47,000.
Those numbers make the October picture more mixed than price alone suggests. BSC continues to process heavy usage, but DEX and perpetual trading have cooled while stablecoin balances have barely changed over the past month.
A move toward $850–$900 would carry more weight if those trends begin turning higher again.
BNB Supply Keeps Falling Ahead of the Next Quarterly Burn
The other side of the equation is supply.
The BNB Foundation destroyed 1,615,827.795 BNB during the 36th quarterly burn on July 15, worth about $931.7 million at the time. The burn left total BNB supply at 133,166,127.91 tokens.
Three months earlier, the 35th burn removed another 1,569,307.34 BNB, then worth roughly $1.02 billion.
Together, the April and July burns removed about 3.19 million BNB in six months.
BNB’s Auto-Burn system is designed to keep reducing supply until it reaches 100 million tokens. Part of the gas fees paid on BSC are also permanently destroyed through BEP-95.
October falls into the next quarterly burn period. The exact amount has not yet been announced, but another reduction in supply would arrive with BNB already trading far above the levels seen earlier in the quarter.
Supply reduction alone does not guarantee a price increase. It becomes more important if trading activity and demand across Binance and BNB Chain are increasing at the same time.
Jenner Gives BNB Another October Catalyst
BNB Chain also has a network event scheduled for late October.
The Jenner hard fork is planned to activate on testnet in late October, with mainnet activation scheduled for late November. Exact fork times have not yet been announced, according to BNB Chain’s official Jenner documentation.
Jenner contains four proposals
- BEP-702 introduces CAS20, a protocol-native token standard for compliant assets including stablecoins and tokenized real-world assets.
- BEP-703 introduces a Payment Lane intended to reserve capacity for qualifying payment transactions when the network is congested.
- BEP-706 adds millisecond-precision block timestamps.
- BEP-714 reduces the initial backup-validator waiting time to one second.
The upgrade follows a broader effort to make BNB Smart Chain faster. In its H2 2026 roadmap, BNB Chain said block intervals had fallen from 750 milliseconds in January to 450 milliseconds by June, while in-memory finality dropped to roughly 650 milliseconds and benchmark throughput climbed to around 5,200 transactions per second.
The network is targeting another doubling of mainnet throughput, while a next-generation architecture under development aims for more than 100,000 transactions per second, sub-50 millisecond transaction pre-confirmation and sub-one-second finality.
Jenner does not guarantee a higher BNB price, but the upgrade adds another event to a month already carrying a quarterly burn and a major resistance test near $800.
Bitcoin Could Still Spoil the Setup
BNB’s own catalysts may not matter much if the wider crypto market turns sharply lower.
Bitcoin has been trading around the low-$80,000s as investors deal with a much tougher bond-market backdrop. The U.S. 10-year Treasury yield reached 5.278% on September 29, its highest level since 2007, while the 30-year yield climbed to 5.6114%, a level not seen since 2002.
The dollar has also strengthened, the dollar index around 101.5 on September 29 as higher U.S. yields and geopolitical tensions supported the currency.
Markets are now assigning close to a 70% probability to another 25-basis-point Federal Reserve rate increase at the late-October meeting, according to CME FedWatch data.
Fed Governor Michael Barr added to those expectations on September 29 when he said further rate increases would likely be needed to bring inflation back under control.
Crypto has already felt the pressure, that Bitcoin fell toward $83,000 as yields rose, while the broader crypto market dropped toward $2.92 trillion and more than $600 million of leveraged positions were liquidated in 24 hours.
Another Bitcoin selloff could make it difficult for BNB to break $800 even if BNB Chain delivers on Jenner and network activity remains strong.
The opposite would also matter. If Bitcoin can stabilize above $80,000 while bond yields stop rising, BNB would begin October only a few percentage points below the high it needs to clear.
October Brings the Fed, Inflation Data, Jenner and Another BNB Burn
BNB will therefore enter October with several events capable of changing the picture quickly.
The U.S. jobs report, inflation releases and PCE data will shape expectations for the Federal Reserve’s late-October meeting. Reuters reported that investors are already treating those releases as important tests for whether another rate hike is needed.
BNB Chain’s Jenner testnet activation is also expected late in the month, while the next quarterly BNB burn falls into the October period.
That combination gives BNB both crypto-specific and macro catalysts during the same month.
A softer inflation reading or weaker Treasury yields could improve risk appetite just as BNB approaches $800 again. Hotter inflation and another rise in yields could have the opposite effect, particularly with more than $1 billion already sitting in BNB futures open interest.
So, How High Can BNB Go in October?
BNB heads into October with a stronger technical structure than the late-September pullback alone suggests.
The double bottom has already broken its neckline, the daily moving-average summary remains on Strong Buy and price is still holding above the rising trendline that has guided the recovery from the summer lows.
The fundamentals are also substantial. BNB Chain carries $13.3 billion in stablecoins, millions of daily users and almost $5 billion in active RWA assets. Binance remains the largest individual centralized trading venue in the major exchange datasets, while BNB supply continues to fall.
But the weak points are equally visible.
MACD and Momentum are on Sell, BSC’s weekly DEX activity has fallen, stablecoin growth has been modest and futures positioning leaves the market vulnerable to liquidations.
That puts $800-$807 at the center of the October outlook.
A sustained daily break above that area would strengthen the double-bottom breakout and put $825 and $850 in view. If spot volume expands and Bitcoin remains stable, the measured move toward roughly $850-$890 and the larger chart resistance near $900-$920 become increasingly relevant.
The downside is just as clearly defined. A move below the mid-$700s would put the $700-$720 neckline under pressure. Losing that region would weaken the double-bottom breakout and bring the $650-$680 area back into consideration.
BNB has already broken out of the recovery structure once. October will show whether that breakout can turn into the next leg of the rally or whether $800 remains the ceiling.
Also Read: Dogecoin (DOGE) Price Prediction 2026, 2027-2030: $1 Target or Supply-Capped Rally?