TRON’s native token, TRX, is trading near $0.34 in late September 2026, with a market capitalization of about $32.3 billion and a circulating supply close to 94.96 billion tokens. That price is roughly 21% below the December 2024 all-time high of $0.4313 recorded on CoinGecko.
The gap between TRON’s on-chain activity and TRX’s relatively tight trading range is the central puzzle for any 2026–2030 forecast.
What is Tron?
TRON is a high-throughput Layer-1 blockchain launched to support cheap, fast value transfer rather than a single consumer app. Its native token, TRX, is used to stake for Bandwidth and Energy, pay fees when those resources run out, vote for Super Representatives, and secure the network under delegated proof of stake. In practice the chain functions mainly as a dollar settlement rail.
TRONSCAN, Tron’s blockchain explorer, records hundreds of millions of accounts and more than $30 trillion in cumulative transfer volume. That combination—low fees, large stablecoin float, and TRX as the gas and staking asset—is what investors are pricing when they look past the headline token price.
What the network is actually doing
TRON’s case for a higher token price rests on payments, not on a broad consumer-app narrative. Messari’s State of TRON Q2 2026 reported that stablecoin market cap on the network rose 4.1% quarter over quarter to a record $89.2 billion at quarter-end, with USDT at 98.5% share. The same report said the chain processed $2.1 trillion in USDT transfers during the quarter and finished as the largest USDT host, with $87.9 billion circulating versus $78.7 billion on Ethereum.
Those figures have continued to scale in the explorer data. TRONSCAN shows more than 405 million total accounts. The explorer’s transfers dashboard lists cumulative transfer volume above $30 trillion.
The official TRON DAO Q2 2026 quarterly report framed the same period as one of high throughput and revenue: 1.1 billion transactions, 16.4 million active users, and $722 million in protocol revenue. That combination—cheap settlement, large dollar float, and recurring fee income—is the fundamental backdrop for TRX. It is also incomplete as a price model, because most of the value moved on TRON is USDT, not TRX.
Tokenomics: usage does not automatically shrink supply
TRX has no hard cap. New tokens are minted as block and voting rewards. Users who lack staked Bandwidth or Energy pay fees by burning TRX. When burns exceed issuance, circulating supply falls. When they do not, supply rises.
TRON DAO’s Q2 2026 report said circulating supply edged up to 94.80 billion from 94.77 billion in Q1, a 0.03% increase. The network minted 356.32 million TRX and burned 269.45 million, leaving 86.87 million in net issuance for the quarter. The burn ratio fell to 0.76, which the report attributed to users staking for resources rather than burning TRX to pay fees.
TRONSCAN’s generated-and-burned series shows the same daily arithmetic in September 2026: generation near 3.92 million TRX a day, burns often in the 2.2 million to 2.6 million range, and a net increase on most days. Messari reached a similar conclusion for Q2, noting that average daily burns fell after the August 2025 energy-fee cut even as transaction counts rose.
That matters for valuation. A token that finances a large payments network can still inflate if the fee design pushes users into staking instead of burning. Staking supports security and resource markets, but it does not reduce float. Any bullish 2030 case that assumes “high usage equals structural scarcity” has to show burns overtaking the roughly 3.9 million daily mint, not merely more USDT transfers.
Institutions on TRX: They have not yet repriced the token
The regulatory overhang around TRON narrowed in 2026, and market access widened. Messari listed several Q2 milestones: Securitize’s first TRON issuance (Hamilton Lane’s tokenized HLSCOPE credit fund), Bitnomial spot TRX on a CFTC-regulated venue, restored Binance.US trading, and Grayscale adding TRX to a quarterly assets-under-consideration list.
The most visible wrapper is the Canary Staked TRX ETF. Canary’s product page describes TRXS as a Cboe-listed fund that seeks TRX price exposure and additional tokens through staking, with a 1.10% sponsor fee. CryptoTimes covered the listing path in Canary Staked TRX ETF (TRXS) to Debut on Cboe September 9 and the first trading tape in Justin Sun’s TRX ETF Debuts on Cboe With Zero Inflows, Just $16,700 in First-Day Volume. Seed assets were about $50 million. Early creations were negligible. That is access, not yet a demand shock.
Stablecoin choice on TRON is also starting to widen at the margin. Ethena Brings USDe and sUSDe to TRON as USDT Dominates documented a Stargate bridge path onto a network that still concentrates almost all dollar activity in USDT. Diversification could matter over a four-year horizon. It does not change the present concentration risk.
Compliance work is part of the same picture. Tether’s May 2026 update on the T3 Financial Crime Unit said the Tether-TRON-TRM Labs effort had frozen more than $450 million in illicit assets. That is relevant to whether large payment flows remain politically durable. It is not, by itself, a reason to mark TRX higher.
How to think about price without treating targets as facts
At the current supply near 95 billion, each $0.10 in TRX price is about $9.5 billion of market cap. One dollar implies roughly $95 billion. Two dollars implies roughly $190 billion. Those are large numbers for a token whose main product is low-cost dollar transfer. They are not impossible if the total crypto market expands and TRON keeps a leading settlement share. They do require more than “the chain is busy.”
Three variables dominate the 2026–2030 path:
- Crypto-market beta. TRX still trades as a large-cap altcoin. A broad risk-on cycle can lift it even if tokenomics stay mildly inflationary. A prolonged risk-off cycle can keep it range-bound despite record transfer volume.
- Value accrual. Price needs a reason for people to hold or stake TRX rather than only use the chain as a USDT rail. Persistent net burns, higher resource prices, or institutional staking demand would tighten that link. The 2025 fee cut loosened it.
- Competitive and regulatory share. Other high-throughput chains and any new regulated dollar rails can take settlement volume. Conversely, clearer stablecoin rules could formalize TRON’s existing role.
TRX Technical Analysis
On the weekly TRX/USDT chart, the larger structure remains an uptrend that began near $0.05 in 2022–2023 and accelerated through 2024 into a spike just under $0.45 in early 2025. That high still caps the range. Price has since worked off the excess with a pullback and a long consolidation, then recovered to about $0.3402 as of the September 24, 2026 weekly close, down 0.73% on the week after trading $0.3386–$0.3493.
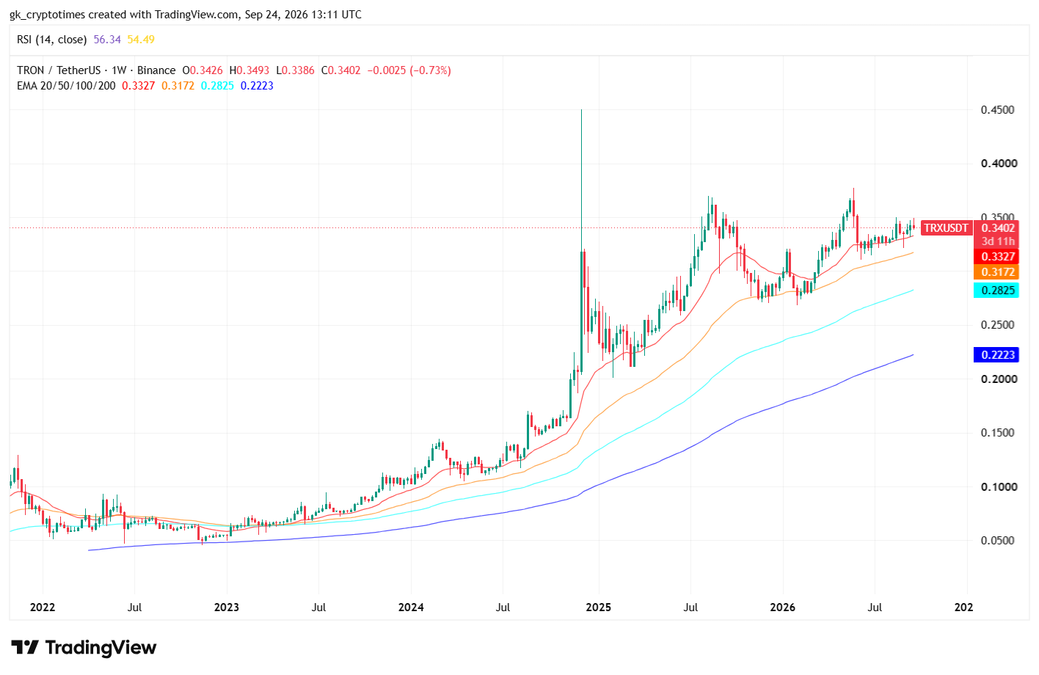
The four exponential moving averages are stacked in a bullish order: the 20-week near $0.3327, the 50-week near $0.3172, the 100-week near $0.2825, and the 200-week near $0.2223. Spot is holding above all four, which keeps the intermediate trend intact even though the market has not reclaimed the 2024–2025 peak.
Momentum is constructive but not stretched. Weekly RSI sits in the mid-50s (about 56 on the close and 54 on the companion reading), below overbought territory and consistent with a grind rather than a breakout. The nearby technical test is the horizontal zone around $0.35, which has capped several weekly attempts this year.
A weekly close through that band would open a path toward the prior swing area in the high $0.30s. Failure to hold the 20-week average near $0.33 would first expose the 50-week near $0.32 and, on a deeper risk-off move, the 100-week region around $0.28—levels that line up with the article’s 2026 bear case. Until one of those boundaries gives way, the chart argues for range-bound trade under the old high, not an immediate trend reversal.
Scenario ranges: 2026 to 2030
These are illustrative bands, not price promises. They start from the September 2026 spot near $0.34 and the supply base published by CoinGecko and TRON DAO.
| Year | Bear | Base | Bull |
|---|---|---|---|
| Remainder of 2026 | $0.24–$0.30 | $0.30–$0.42 | $0.45–$0.50 |
| 2027 | $0.25–$0.35 | $0.35–$0.55 | $0.55–$0.80 |
| 2028 | $0.30–$0.45 | $0.45–$0.75 | $0.75–$1.10 |
| 2029 | $0.35–$0.50 | $0.50–$0.90 | $0.90–$1.40 |
| 2030 | $0.40–$0.70 | $0.55–$1.10 | $1.20–$2.00 |
Remainder of 2026:
Base case: $0.30 to $0.42, with most trading still below the 2024 high. A market-wide rally plus visible ETF creations could test the bull band of $0.45–$0.50. A risk-off quarter could revisit the high-$0.20s. Network data already in the market makes a sudden collapse from utility loss less likely than a continuation of the recent range.
2027
Base case: $0.35 to $0.55. This year is when tokenomics become testable. If daily burns move back above the ~3.9 million mint and institutional wrappers add persistent demand, the upper half of the base band and the $0.55–$0.80 bull case are more plausible. If staking continues to absorb fees and supply keeps drifting higher, TRX can post strong usage metrics and still sit in the $0.25–$0.35 bear zone while lagging other large caps.
2028
Base case: $0.45 to $0.75. By then the question is whether TRON is still the default cheap-dollar chain in a larger stablecoin market. Various market research already described TRON as the leading chain for certain crypto-card volumes in Q2 2026. Holding that payments niche through another cycle would support the base multiple. Losing share to faster or more developer-heavy networks would cap the token in the $0.30–$0.45 bear band even if absolute transfer volume is still large. Keeping share through a broader upcycle is what fills the $0.75–$1.10 bull range.
2029–2030
Base case into 2030: $0.55 to $1.10, with a wide error bar. A constructive path—stablecoin float still concentrated on TRON, net issuance near zero or negative, and a larger crypto market—can put $1 in reach and, in the bull case, $1.20–$2.00. That $1 print is a market-cap event, not a round-number slogan. A weaker path—mild inflation, concentrated USDT risk, and muted ETF demand—can leave TRX in the $0.40–$0.70 bear zone even after four more years of real settlement activity.
A bull extension toward $1.20–$2.00 by 2030 would need several things at once: a powerful market cycle, durable share of global dollar stablecoins, and a tighter mapping from fees to token scarcity. A bear extension back toward $0.25–$0.40 would follow from a deep crypto contraction, a stablecoin migration off TRON, or a policy shock that hits Tether-linked rails.
Risks that cut both ways
Concentration is the main risk. Messari’s 98.5% USDT share figure means TRON’s throughput thesis is tightly bound to one issuer and one token. Tether’s own attestations and the T3 freezes show an active compliance layer, but they also underline that the rail is not politically invisible.
Governance and structure are the second risk. TRON uses delegated proof of stake with a small Super Representative set. That design is efficient. It is also easy for critics to call centralized. Markets have lived with that trade-off for years; they may not ignore it forever if a competitor offers similar fees with a different political profile.
The third risk is mathematical. High circulating supply leaves less room for multiple expansion unless demand for TRX as collateral, gas, and stake grows faster than float. Explorer data in September 2026 still shows net daily issuance. Until that flips for a sustained period, “deflationary TRON” is a historical phase, not the current default.
Bottom line
TRON is one of the few large blockchains whose activity is dominated by payments rather than speculation. A neutral reading of the evidence is that TRX is more likely to grind higher with the next broad crypto cycle than to reprice immediately on settlement headlines. The reasonable working range is consolidation through late 2026, a possible $0.35–$0.75 band across 2027–2028, and a 2030 outcome centered below or around $1 unless burns, staking demand, and market beta all improve together.
Readers should treat every year-labeled number as a scenario, check live figures on the linked original pages, and seize any exposure for volatility that official dashboards cannot forecast.
Also read: Zcash (ZEC) Price Prediction 2026, 2027–2030: Is $2,000 the Next Stop?