
Ethereum is trading near $2,700 as of 21 September 2026, well below its August 2025 peak near $4,946. That gap is the starting point for any serious ETH price discussion through 2030: the network still settles a large share of on-chain finance, while the token has lagged its own usage metrics.
This article does not pick a single target. It maps published original forecasts, states their assumptions, and separates those numbers from what on-chain data can support. None of the figures below is a promise of future returns.
Where Ethereum stands heading into late 2026
On DefiLlama’s Ethereum dashboard, the chain recently showed roughly $53 billion in DeFi total value locked, about $147 billion in stablecoins on the network, and more than $13 billion in active real-world asset AUM. Daily transactions were around 1.7 million, with hundreds of thousands of active addresses. Those figures describe economic activity. They do not automatically set a token price.
That distinction matters. Price is a claim on future demand for ETH as gas, collateral, and staked capital. Activity can rise while ETH underperforms if fees migrate to Layer 2s, if liquid supply stays high, or if risk appetite stays weak. The reverse is also true: a liquidity cycle can lift ETH faster than fundamentals.
For context on how traders have framed year-end 2026 liquidity bets, see Arthur Hayes’ $10,000 Ethereum call. That is a near-term liquidity thesis, not a 2030 valuation model.
How to read a 2030 ETH forecast
Long-horizon crypto targets usually rest on one of four methods:
- Cash-flow models that treat protocol fees and related revenue as something like free cash flow to token holders.
- Relative-value models that apply an ETH/BTC ratio to a Bitcoin target.
- Expert surveys that average many individual guesses.
- Statistical / algorithmic paths that extrapolate historical volatility and trend.
Each method can be internally consistent and still be wrong. A cash-flow model fails if Layer 2s keep most fees. A ratio model fails if Bitcoin’s path is wrong. A survey average hides disagreement. An algorithm has no view on regulation or tokenization.
Original 2030 forecasts, side by side
VanEck (June 2024 research)
In ETH 2030 Price Target and Optimal Portfolio Allocations, Matthew Sigel’s team published a base case of $22,000 per ETH. The same table shows a bull case of $154,000 and a bear case of $360. The base case assumes Ethereum keeps about 70% terminal smart-contract market share, generates about $66 billion in free cash flow to token holders, and is valued at a 33x multiple.
VanEck discloses that it holds ether and bitcoin and that the work is not investment advice. The date also matters: the model was written when ETH traded much higher than today’s level, so the implied percentage return from today’s price is larger than the 487% figure printed in 2024.
Standard Chartered / Geoffrey Kendrick
The bank’s digital-assets desk has publicly restated a $40,000 2030 path in client notes and interviews. In a Milk Road conversation, Kendrick tied the long-term number to tokenization, stablecoins, and an ETH/BTC recovery toward levels last seen in 2021. He also restated a nearer $4,000 year-end 2026 marker in later comments after cutting earlier 2026 prints.
The bank’s own research is not posted as an open retail PDF; the figures cited here come from Kendrick’s on-record remarks and from Standard Chartered’s Ethereum 2026 outlook as covered by The Crypto Times. Treat the $40,000 print as one institutional scenario, not a consensus.
Fundstrat / Tom Lee (ratio framework)
Lee has described ETH as a function of Bitcoin and the ETH/BTC ratio. In remarks covered in BitMine’s Tom Lee on a $12,000–$22,000 Ethereum range, he used an eight-year average ratio near 0.0479 and the 2021 high near 0.0873. If Bitcoin were $250,000, those ratios imply roughly $12,000 and $22,000 ETH. The ETH number is therefore only as strong as the Bitcoin assumption.
A practical map for 2026–2030
The table below is a scenario map, not a price target. It groups the original sources above rather than inventing a new model.
| Horizon | Cautious band | Mid band | Aggressive band | What has to go right or wrong |
|---|---|---|---|---|
| End-2026 | $2,000–$3,300 | $3,500–$5,000 | $7,500–$10,000 | Liquidity, ETF flows, whether ETH holds above the 2026 range |
| 2027–2028 | $2,500–$5,000 | $6,000–$12,000 | $15,000–$22,000 | Scaling, fee capture, tokenization volume |
| 2030 | $3,500–$6,000 | $8,000–$22,000 | $25,000–$40,000 | Market share, ETH/BTC, regulation, value accrual to L1 |
From about $2,700, the mid 2030 band implies a multiple of roughly 3x to 8x. The aggressive band implies 9x to 15x. Those multiples are large enough that small changes in adoption or discount rates swing the outcome.
Ethereum Technical Analysis (September 2026)
On the weekly ETH/USD chart from Coinbase, ether closed the latest candle at $2,715 after opening near $2,644, posting a 2.69% gain and reclaiming ground above the 100-week EMA at $2,558 and the 200-week EMA at $2,469. The 20-week EMA remains the lowest of the four moving averages at $2,247, a configuration that reflects the steep 2026 decline from the August 2025 peak near $4,950; price has now climbed back through the 50-week EMA at $2,403 and is attempting to rebuild a bullish stack.
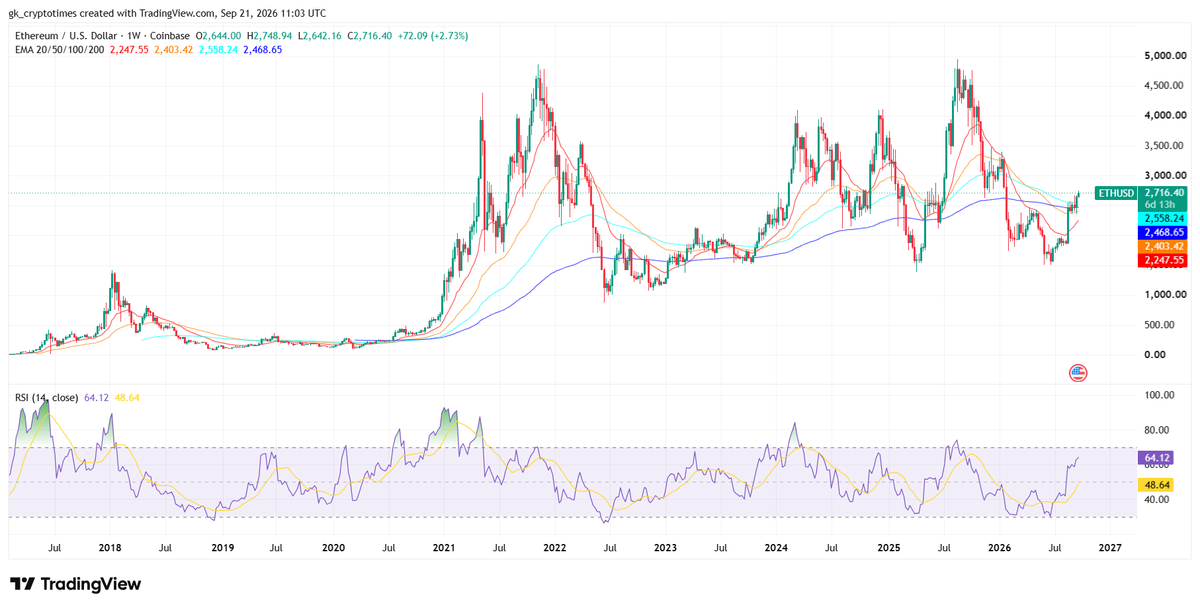
The recovery sequence of higher weekly closes from the mid-$2,200s suggests the prior downtrend is losing momentum, though a decisive weekly close above the $2,750–$2,800 zone would be needed to confirm a sustained shift in structure.
Weekly RSI has turned higher to 64.11 from oversold readings near the 30–40 area earlier in 2026, while its moving average sits at 48.64, indicating momentum is improving but has not yet reached the overbought extremes that marked the 2021 and 2025 tops.
As long as RSI holds above the 50 midline on a weekly basis and price remains above the 100- and 200-week EMAs, the chart supports a constructive bias into the remainder of 2026; a failure back below $2,470 would return focus to the 20-week EMA and the $2,200 support region that defined the recent low.
What could support a higher path
- Settlement share: Ethereum still hosts a large share of stablecoins and tokenized assets. If that share holds while those markets grow, demand for blockspace and collateral can rise even if retail speculation is quiet.
- Staking and float: A higher share of supply locked in validation reduces liquid ETH. That tightens the float only if new issuance and L2 exits do not offset it.
- Institutional rails: Spot ether products and corporate treasuries create a bid that did not exist in earlier cycles. They also create a source of selling when premiums collapse.
- Protocol upgrades: Roadmap work that improves data availability and fee markets can raise throughput. The open question is how much of that activity settles as ETH burn or L1 fees rather than as L2 revenue.
What could keep ETH in the lower band
- Fee leakage: If most user activity stays on Layer 2s and L1 capture stays thin, cash-flow models that assume tens of billions in token-holder FCF will miss.
- Competition: Other execution layers can take developers, users, and issuance of new tokenized products.
- Macro and regulation: Tighter dollar liquidity, weaker risk appetite, or restrictive rules for staking, stablecoins, and intermediaries can cap multiples even if usage is healthy.
- Ratio risk: Any ETH forecast built off Bitcoin inherits Bitcoin’s forecast error. A lower BTC terminal price, or a stuck ETH/BTC ratio, cuts those estimates immediately.
2026 is the hinge year
Most desks now treat 2026 as a test of whether ETH can re-rate versus Bitcoin after a long stretch of underperformance. Standard Chartered previously called 2026 “the year of Ethereum” while still cutting dollar targets when the whole market weakened. That combination is internally consistent: relative strength can improve even if absolute prices stay below old highs.
Hayes’ year-end $10,000 figure, if it is reached, would still leave 2030 wide open. It would only show that liquidity returned. It would not prove VanEck’s cash-flow case or Kendrick’s $40,000 path.
How to use these numbers without over-fitting them
A reader comparing sources should ask four questions:
- Is the author publishing a model, a ratio, or a guess?
- What market share and fee capture does the model need?
- How old is the note? VanEck’s detailed 2030 table is from June 2024.
- What happens in the bear case? VanEck printed $360. Finder’s panel included $500 for 2030. Those tails are part of the record.
For 2026, the evidence supports a wide range rather than a point forecast. Holding the current band and grinding toward the low-to-mid thousands is compatible with the conservative models. A move toward Finder’s $5,026 average would require a clearer risk-on tape and stronger ETH/BTC. Prints near $7,500–$10,000 sit in the aggressive tail.
For 2030, the honest summary is this: original published work clusters in three neighborhoods. Mechanical models sit near $4,000–$6,000. Survey averages and ratio frameworks sit near $12,000–$22,000. One bank scenario sits at $40,000. The distance between those neighborhoods is the story. It is not a rounding error. It is disagreement about whether Ethereum becomes core financial infrastructure and whether ETH captures that value.
This article is for information only. It is not a recommendation to buy or sell ether. Cryptocurrency can fall sharply and stay there. Compare primary research, check dates, and size any exposure to a loss you can absorb.
Also read: Solana (SOL) Price Prediction 2026, 2027–2030: Will It Hit $300 High?