
Key Highlights
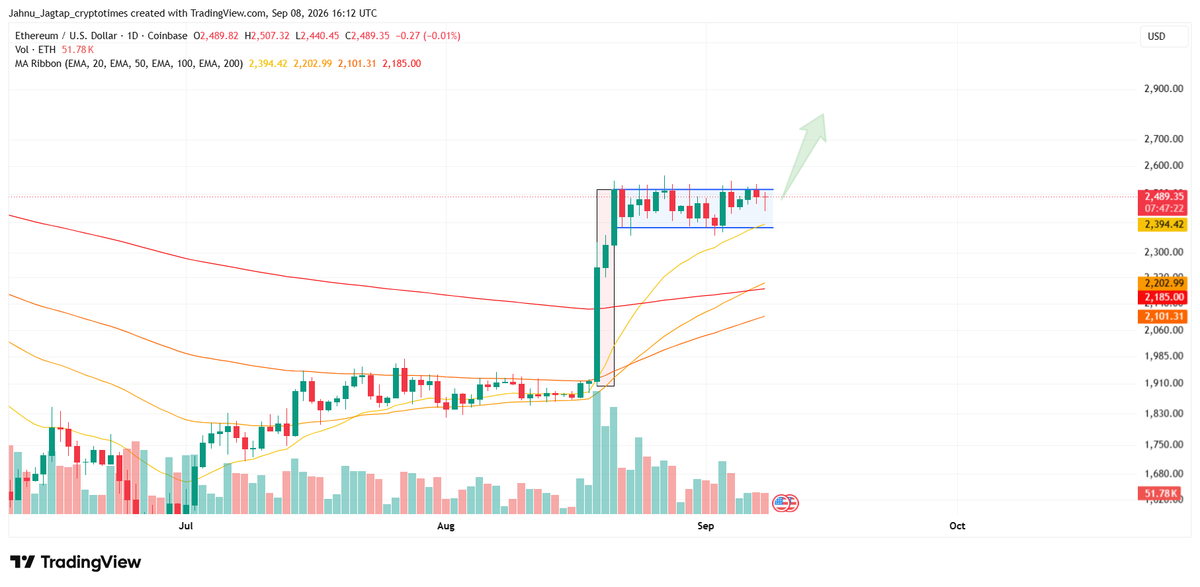
- Ethereum traded at $2,489.35 as of 16:12 UTC on September 8, after reaching an intraday high of $2,507.32 and a low of $2,440.45.
- ETH remains above its 20-, 50-, 100- and 200-day EMAs, while the 20-day EMA at $2,394.42 reinforces the lower end of its current consolidation.
- A sustained breakout above $2,500-$2,510 could open a move through $2,600 and $2,700 toward the $2,800 upside target plotted on the daily chart.
Ethereum (ETH) traded at $2,489.35 as of 16:12 UTC on September 8, remaining almost unchanged during the daily session as the cryptocurrency continued to consolidate near $2,500.
ETH opened the Coinbase daily candle at $2,489.82, climbed to an intraday high of $2,507.32, and fell as low as $2,440.45 before returning near its opening price, according to the TradingView.
Ethereum was also roughly 0.9% above its August 31 close of $2,467.65 at the same timestamp, based on historical ETH price data. That comes after ETH gained 32.6% in August, making September’s consolidation particularly important for determining whether the rally can extend.
The current structure leaves two levels at the center of the September outlook: resistance around $2,500-$2,510 and support around $2,394-$2,400.
Ethereum Price Outlook for September 2026
| Scenario | Potential September Range | What Would Confirm It |
|---|---|---|
| Base Case | $2,400-$2,700 | ETH keeps the $2,394-$2,400 support intact and eventually establishes itself above $2,510, but momentum remains insufficient for a sustained move to $2,800. |
| Bullish Case | $2,700-$2,800 | ETH closes decisively above $2,510, holds above $2,600 and continues through $2,700 with support from spot demand and a favorable macro backdrop. |
| Bearish Case | $2,180-$2,400 | ETH loses the 20-day EMA near $2,394 and fails to reclaim $2,400, exposing the 50-day and 200-day EMA cluster around $2,185-$2,203. |
At $2,489.35, Ethereum remains closest to the base-case structure. The bullish scenario requires confirmation above the current range, while the bearish case would become more relevant only if the support that has developed around $2,400 begins to fail.
Ethereum Consolidates Between $2,400 and $2,510
Ethereum’s daily chart showed ETH holding inside a defined consolidation range as of 16:12 UTC on September 8, following its sharp late-August breakout.
The upper boundary sits around $2,500-$2,510, where several recent candles have struggled to establish a sustained move higher. ETH again reached $2,507.32 on September 8 before moving back below $2,500.
The lower end sits close to $2,400, where the rising short-term trend has started to catch up with price.
The structure follows the late-August rally in which Ethereum climbed more than 30% in one week, moving from around $1,900 to above $2,500 before encountering resistance in the $2,500-$2,600 area.
Rather than immediately reversing that advance, ETH has so far maintained much of the move while trading sideways. That makes the consolidation important: a breakout would suggest buyers are prepared to extend the rally, while a breakdown would indicate the August impulse is losing momentum.
ETH Holds Above All Four EMAs
Ethereum remained above each of the exponential moving averages plotted on the daily chart at 16:12 UTC on September 8.
The 20-day EMA stood at $2,394.42, placing it almost directly beneath the current range. The 50-day EMA was at $2,202.99, while the 100-day and 200-day EMAs stood at $2,101.31 and $2,185.00, respectively.
That positioning gives the $2,394-$2,400 area additional significance. It is not only the lower edge of the consolidation but also the first major dynamic support underneath the current price.
A temporary move through $2,400 would not automatically reverse the trend. However, a sustained daily close below the 20-day EMA would weaken the short-term structure and increase the possibility of ETH moving toward its longer-term averages.
Can Ethereum Price Reach $2,800 in September?
The chart’s bullish projection puts $2,800 at the end of a potential breakout from the current range.
Ethereum must first establish a sustained move above $2,500-$2,510. The September 8 intraday high at $2,507.32 shows that price is already testing this boundary, but ETH had not secured the breakout by the chart’s 16:12 UTC.
If $2,510 turns from resistance into support, the first area to watch would be around $2,600. That would mark the first expansion beyond the consolidation that has contained ETH since late August.
A continuation through $2,600 could then bring $2,700 into focus before the charted $2,800 target.
From $2,489.35, ETH would need to rise approximately 12.5% to reach $2,800. The percentage is within the scale of moves Ethereum recorded during August, but the target remains conditional on price first escaping the current range.
The $2,800 level should therefore be treated as the bullish September extension, not as a guaranteed month-end price.
Ethereum ETF Flows Remain Positive in September
U.S. spot Ethereum ETFs have continued to attract net capital during the opening sessions of September, although daily flows have been uneven.
According to Farside Investors, the funds recorded $8.6 million of net inflows on September 1, followed by $48.2 million of outflows on September 2.
Flows then reversed sharply. The products attracted $141.4 million on September 3 and another $25.9 million on September 4, bringing cumulative September net inflows to approximately $127.7 million through the latest completed session with fund-level flow data at the time of writing.
The September figures follow a considerably stronger institutional bid during the late-August rally.
Between August 17 and August 27, U.S. Ethereum ETFs attracted around $1.42 billion over nine consecutive positive sessions, while BlackRock’s ETHA accounted for about $1.02 billion of those inflows.
That buying coincided with ETH moving from around $1,900 toward $2,500.
Continued ETF inflows would give an eventual move above $2,510 a stronger spot-demand foundation. If flows turn persistently negative, however, a breakout would become more dependent on short-term derivatives positioning.
ETH Futures Open Interest Stays Above $33 Billion
Leverage remains another important component of Ethereum’s September setup.
CoinGlass showed Ethereum futures open interest at approximately $33.67 billion as of around 17:50 UTC on September 8. Futures volume over the preceding 24 hours stood near $39.14 billion, while reported spot volume was about $2.10 billion.
The large amount of outstanding derivatives exposure means Ethereum’s eventual move outside the $2,400-$2,510 range could accelerate after the initial break.
A move above $2,510 could force some traders positioned for lower prices to close their positions, adding buying pressure. A break below $2,400 could produce the opposite effect by putting leveraged long positions under pressure.
That is why the nature of any breakout matters. A move backed by sustained spot buying and ETF inflows would provide stronger confirmation than a brief spike driven mainly by liquidations.
Staking Demand and L2 Activity Add to Ethereum’s Backdrop
Ethereum’s network data also points to continued demand for staking.
The beaconcha.in validator queue showed roughly 1.95 million ETH waiting in the deposit queue when checked on September 8, with an estimated processing time of about 34 days at the current 256 ETH-per-epoch deposit churn limit.
The backlog is smaller than the 2.23 million ETH recorded in mid-August but remains substantial, indicating that a large amount of Ether is still waiting to enter validator staking.
Activity across Ethereum’s Layer 2 ecosystem has also remained high.
As of the completed September 7 UTC session, Ethereum L2 networks processed approximately 25.01 million daily transactions, compared with 1.86 million on Ethereum mainnet, according to growthepie. That puts L2 transaction activity at roughly 13.4 times mainnet levels.
L2 throughput was also about 28.2 times mainnet throughput during the same period. However, rising L2 activity does not automatically translate into a higher ETH price because the relationship between scaling usage, fees and value captured by the base layer remains more complex.
The network figures are therefore better viewed as support for Ethereum’s broader usage backdrop rather than confirmation that the $2,800 price target will be reached.
September Seasonality Remains a Headwind for ETH
Ethereum’s historical September performance provides a less supportive signal.
RiskWhale’s Ethereum seasonality data shows an average September return of -5.9% and a median return of -5.6% across the available history since 2016. Only 45% of completed Septembers in the dataset finished positive.
Recent years have also been mixed. ETH fell 5.6% in September 2025, gained 3.5% in 2024 and rose 1.5% in 2023, after declines of 14.5%, 12.5% and 17.1% in 2022, 2021 and 2020, respectively.
Seasonality alone is not enough to forecast price, particularly given Ethereum’s relatively short market history.
However, the pattern is worth noting this year because ETH entered September immediately after a 32.6% August gain. A period of consolidation after that advance would therefore not be unusual even if the broader recovery remains intact.
CPI and Fed Decision Could Determine the Breakout
The most important catalysts for Ethereum’s September range may come from outside the crypto market.
The U.S. Bureau of Labor Statistics is scheduled to release the August Consumer Price Index on September 11 at 12:30 UTC. The inflation reading arrives only days before the Federal Reserve’s September policy decision.
The Federal Reserve’s September calendar shows the FOMC meeting running from September 15 to 16. The policy statement is scheduled for 18:00 UTC on September 16, followed by Chair Kevin Warsh’s press conference at 18:30 UTC.
Rate expectations have become more hawkish ahead of those events.
Market participants were pricing approximately a 60% probability of a September rate hike on September 8, according to CME FedWatch data. The probability had increased as stronger employment data and oil prices near $100 reinforced inflation concerns.
That creates two distinctly different macro paths for Ethereum.
A softer inflation reading that reduces the probability of a rate hike could ease pressure on Treasury yields and the dollar. Such a backdrop would make an ETH move through $2,510 easier to sustain, particularly if ETF inflows remain positive.
A hotter CPI print followed by a hawkish Fed outcome could instead tighten financial conditions further and put the $2,394-$2,400 support zone under renewed pressure.
The CPI-Fed sequence therefore arrives at an important point technically: Ethereum is already trading near the upper end of its range, meaning a macro catalyst could help determine whether the consolidation resolves upward or downward.
Ethereum Price Prediction for September 2026
Ethereum’s September setup remains constructive, but the bullish move has not yet been confirmed.
The first requirement is a sustained break above $2,500-$2,510. If ETH can turn that resistance into support, the chart opens a path toward $2,600, followed by $2,700 and ultimately the plotted $2,800 bullish target.
The downside setup is equally clear.
The $2,394-$2,400 region combines the lower end of the recent trading range with Ethereum’s rising 20-day EMA. A sustained daily break below that area would weaken the short-term setup and bring the $2,185-$2,203 200-day and 50-day EMA cluster into focus.
For now, the base case remains a broader $2,400-$2,700 September range, while $2,800 becomes the bullish extension if ETH confirms a breakout above $2,510 and maintains momentum through $2,600 and $2,700.
ETF flows, futures positioning and network activity provide support to the recovery, but the September 11 CPI release and September 16 Fed decision are likely to be the most important near-term tests.
Until one side of the range breaks, Ethereum’s September outlook remains defined by $2,510 above and $2,394-$2,400 below.
Also Read: XRP Price Prediction September 2026: Can XRP Break $1.50?