Key Highlights
- XRP traded near $1.40 on September 7, with an intraday high around $1.43 and low near $1.38, while remaining above its major long-term moving averages.
- U.S. spot XRP ETFs recorded $18.96 million in net inflows during the week ending September 4, extending the positive flow trend but slowing sharply from $110.49 million a week earlier.
- The current structure leaves $1.35–$1.31 as an important support zone, while a sustained break above $1.50–$1.55 could reopen a move toward $1.70 and the $1.84 Fibonacci resistance.
XRP has entered September trading near $1.40 after its sharp August recovery lost momentum below the $1.50 region, leaving traders to assess whether the rebound has enough support to challenge the token’s August high and extend toward $1.84.
The token traded around $1.40 as of approximately 17:35 UTC on September 7, with an intraday high of about $1.43 and a low near $1.38. CoinGecko data showed XRP’s market capitalization at approximately $89.26 billion on September 7, while daily trading volume stood near $1.46 billion.
Volume has cooled substantially since September 4, when XRP recorded more than $4.17 billion in trading activity. The decline suggests that the latest consolidation is taking place with less market participation than the volatility seen earlier in the month.
The September outlook now depends on whether XRP can defend the long-term support reclaimed during August while attracting enough spot and institutional demand to break through the resistance sitting between the current price and $1.70.
XRP Breaks Descending Channel but $1.40 Support Faces Test
XRP’s daily chart shows the token attempting to establish a higher price structure after breaking out of the descending channel that formed following its sharp August rally.
At 19:55 UTC on September 7, XRP traded at $1.4017 on Coinbase, down 1.53% on the daily candle. The price had opened at $1.4236, reached an intraday high of $1.4312 and fell as low as $1.3780, according to TradingView data.
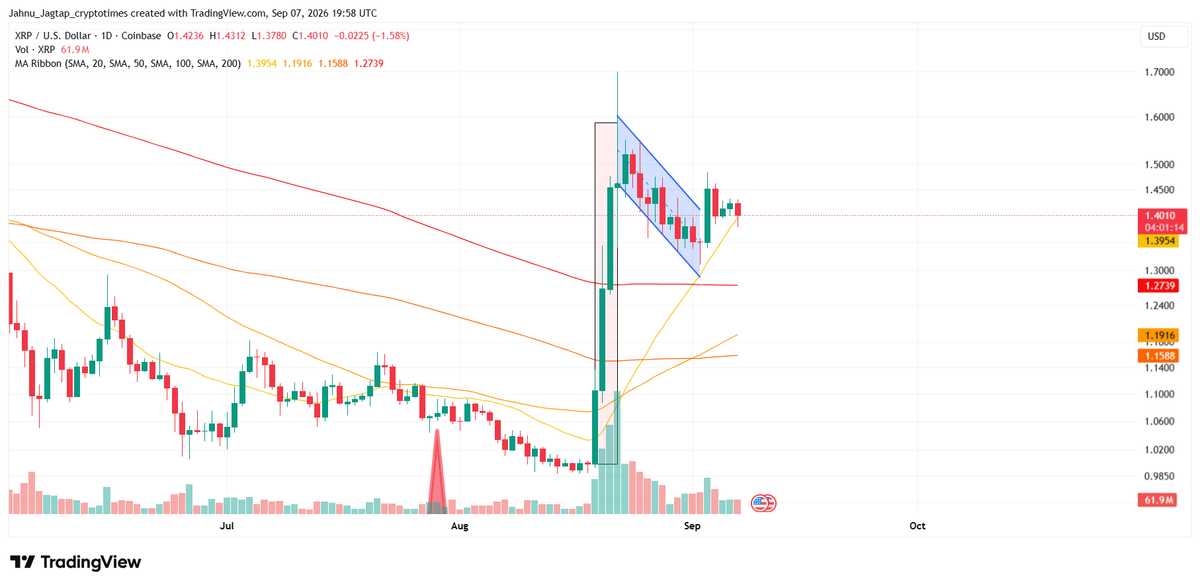
The chart shows XRP surging from around $1.00 in the second half of August before briefly reaching the $1.70 area. That advance was followed by a controlled pullback inside a descending channel, with lower highs and lower lows carrying the price back toward the $1.30 region.
XRP subsequently moved above the channel’s upper trendline in early September, weakening the short-term bearish structure. However, the breakout has not yet developed into another sustained leg higher, with the price consolidating around $1.40.
The 20-day simple moving average stood at $1.3954, placing XRP almost directly on its nearest short-term trend support. Holding above that average would keep the recent breakout structure intact and leave the $1.43–$1.45 region as the first resistance to reclaim.
The longer-term moving averages remain considerably below the current price. XRP’s 50-day SMA stood at $1.1916, the 100-day SMA at $1.1588, and the 200-day SMA at $1.2739 at the same timestamp.
That leaves the 200-day SMA as the most important longer-term support if the current $1.39–$1.40 area fails.
As The Crypto Times reported on September 3, XRP was trading above its 200-day simple moving average at $1.2748, its 20-day SMA at $1.3096 and its 200-day exponential moving average near $1.3514.
The chart also shows a rising short-term support line developing from the late-August low near $1.28. XRP is now testing the intersection between that rising trendline and its 20-day SMA, making the current area important for determining whether the breakout from the descending channel can hold.
A daily recovery above $1.43–$1.45 would strengthen the breakout and bring $1.50–$1.55 back into focus. A sustained move below the 20-day SMA, however, would weaken the setup and increase the possibility of another test of $1.30–$1.27, including the 200-day SMA.
Can XRP Price Reach $1.84 in September?
The $1.84 level remains technically relevant, but XRP has several resistance levels to clear before it becomes an immediate price objective.
The daily Fibonacci structure reviewed by The Crypto Times on September 3 placed the 0.618 Fibonacci retracement at $1.8433, with the level calculated from XRP’s wider price structure and previous high around $4.01.
XRP was considerably below that level at the time, meaning $1.84 represented a higher resistance zone rather than a near-term breakout already underway.
That remains the case heading deeper into September.
From approximately $1.40, XRP would need to gain about 31% to reach $1.84. The path would likely require the token to first sustain a move above $1.50–$1.55 before challenging the August swing high near $1.70.
A break above $1.70 would be particularly important because that area marked the upper end of the previous rally. Clearing it would establish a higher high and strengthen the case that XRP’s August recovery has developed into a broader trend rather than another temporary rebound.
Under that scenario, $1.84 would become the next major technical resistance.
Without a break through $1.50–$1.55 and subsequently $1.70, however, $1.84 remains a bullish extension rather than the base case for September.
XRP ETF Inflows Continue but Slow From August Surge
Institutional demand through U.S. spot XRP ETFs remains one of the stronger factors supporting the current market structure, although inflows slowed substantially during the first week of September.
Spot XRP ETFs recorded $18.96 million in net inflows during the week ending September 4, according to SoSoValue data. The funds remained in positive territory for an eighth consecutive week.
That followed a much stronger $110.49 million inflow during the week ending August 28, the largest weekly intake for XRP ETFs in 2026. The August surge pushed cumulative net inflows to approximately $1.66 billion, while total net assets reached about $1.44 billion.
The week-on-week slowdown does not indicate that institutional demand has reversed, but it does reduce the pace at which new ETF capital is entering the market.
For XRP’s September price structure, a renewed acceleration in ETF inflows alongside a move above $1.50 would provide stronger confirmation that spot demand is supporting another attempt at the August highs.
Continued inflows accompanied by a stagnant price, by contrast, would suggest that ETF demand is being absorbed by selling elsewhere in the market.
XRP Futures Shift Toward CME as Overall Leverage Falls
XRP’s August rally also produced an unusual change in the derivatives market.
Total XRP futures open interest fell from approximately 2.77 billion XRP on August 17 to 2.34 billion XRP by August 31, even as the token recovered from roughly $0.99 to $1.38 over the same period.
That represented a decline of about 15.5% in total futures exposure while XRP’s price increased, indicating that the rally was not accompanied by an equivalent expansion in overall leveraged positions.
CME moved in the opposite direction.
Open interest tied to XRP futures on the regulated U.S. exchange increased from about 284 million XRP to 387 million XRP, a rise of roughly 36%. CME’s share of outstanding XRP futures exposure consequently increased from around 10% to approximately 17%.
The shift suggests that a larger proportion of XRP futures activity is moving toward a regulated venue commonly used by professional market participants.
It does not by itself establish a bullish price direction because futures positions can be used for both directional exposure and hedging. However, the combination of falling aggregate leverage and rising CME participation gives the August rally a different structure from one driven mainly by expanding offshore futures speculation.
Fed Decision Adds Macro Risk to XRP’s September Outlook
XRP’s September trajectory will also depend on conditions outside the cryptocurrency market.
The U.S. economy added 162,000 nonfarm payrolls in August, while the unemployment rate remained unchanged at 4.1%, according to the Bureau of Labor Statistics’ September 4 employment report.
The labor-market reading has kept monetary policy expectations in focus ahead of the Federal Reserve’s next decision.
The Federal Open Market Committee is scheduled to meet on September 15–16, with the policy statement due at 2:00 p.m. ET on September 16 and the press conference following at 2:30 p.m. ET. The meeting will also include an updated Summary of Economic Projections.
A more restrictive policy outlook could pressure liquidity-sensitive assets and make it harder for XRP to sustain a breakout through its August highs. A softer inflation backdrop or a less restrictive Fed message could instead reduce that macro pressure, leaving XRP’s ETF flows and technical structure with greater influence over the second half of September.
CLARITY Act Vote Adds Another September Catalyst
U.S. crypto regulation could create another source of volatility one day before the Fed decision.
The Senate is scheduled to hold a procedural vote related to the CLARITY Act on September 15, after Senate Majority Leader John Thune filed cloture on the motion to proceed to H.R. 3633 before the August recess.
The vote is important, but it is not a final Senate vote on the legislation.
As The Crypto Times’ CLARITY Act vote analysis explained, the September 15 vote will determine whether senators can invoke cloture and move toward formally considering the legislation.
With all 100 Senate seats filled, cloture generally requires 60 votes under Senate Rule XXII. Republicans hold 53 seats, meaning at least seven Democrats or independents would be required if the Republican conference remains united.
The development is particularly relevant to XRP because Ripple and its executives have been closely involved in the broader U.S. debate over digital asset regulation.
A successful procedural vote would not mean CLARITY has become law, but it could provide the market with a clearer indication of whether comprehensive U.S. crypto market-structure legislation has enough bipartisan support to advance.
The legislative path could still remain lengthy. The House is expected to leave Washington after September 17, potentially complicating the timeline if the Senate makes changes that require another House vote.
XRP Price Prediction for September 2026
Based on the current technical structure, ETF flows, derivatives positioning and September’s macro calendar, XRP has three broad scenarios for the remainder of the month.
| Scenario | XRP Range | What Would Support It |
|---|---|---|
| Base case | $1.35–$1.60 | XRP holds long-term support and gradually reclaims $1.45 before testing $1.50–$1.55 |
| Bullish case | $1.70–$1.84 | Price breaks $1.55, clears the August high near $1.70 and receives support from stronger spot or ETF demand |
| Bearish case | $1.25–$1.35 | XRP loses $1.35 and $1.31 as broader crypto markets weaken or macro conditions become more restrictive |
The $1.35–$1.60 range currently provides the more balanced September scenario because XRP remains above long-term support but has not yet confirmed a breakout through the resistance that capped its August rally.
Within that range, a move toward $1.45–$1.60 by month-end would remain consistent with the current recovery structure without requiring XRP to immediately produce another 20%–30% advance.
The bullish case becomes stronger if XRP establishes daily closes above $1.50–$1.55. That would shift attention toward the August high around $1.70, with a break above that level opening the technical path toward $1.8433.
The bearish scenario would strengthen if XRP loses the $1.35 region and fails to recover it. A sustained move below $1.31 would weaken the moving-average structure further and bring the $1.25–$1.27 area back into focus.
What Could Confirm XRP’s Next Move?
XRP enters the remainder of September with its broader recovery still intact, but the next move requires confirmation from both price and market participation.
On the upside, a sustained break above $1.50–$1.55, followed by a move through the August high near $1.70, would provide the clearest technical evidence that XRP is ready to challenge $1.84.
ETF flows could provide another confirmation. XRP products continue to attract capital, but weekly inflows have dropped from $110.49 million to $18.96 million. A renewed acceleration in flows alongside rising spot volume would strengthen the demand side of the breakout.
On the downside, $1.35 remains the first level that could challenge the current recovery structure. Losing that area would shift attention toward $1.31 and the 200-day SMA near $1.27.
The September 15 CLARITY Act vote and September 16 Federal Reserve decision add two major event risks around the middle of the month, giving XRP both crypto-specific and macro catalysts before traders can determine whether the August recovery has another leg higher.
For now, $1.84 remains achievable under a bullish September scenario, but it is not yet confirmed by the price structure. XRP first needs to turn its current consolidation above long-term support into a sustained breakout through the resistance left behind by its August rally.
Also Read:ZEC Price Prediction for September: Will It Cross $2,200?