Key Highlights
- XRP sank below $1.10 on June 5, undercutting February’s $1.11 flash-crash low to set a new 2026 bottom.
- Spot XRP ETFs hold about $1.5 billion in cumulative inflows, yet price has stopped responding to bullish supply data.
- Bitcoin’s 30% yearly drawdown, Ripple’s June 1 escrow release, and a stalled CLARITY Act floor vote are outweighing every positive catalyst.
XRP sank below $1.10 on June 5, breaking February’s $1.11 flash-crash low to set a fresh 2026 bottom, even as spot XRP ETFs continued drawing money and the CLARITY Act formally reached the Senate calendar.
The Breakdown, in Numbers
XRP closed May at $1.33, lost the $1.25 support on June 2, and then fell through $1.20 three days later. The June 5 session saw volume surge to 268.2 million XRP in a single hour, the kind of spike is usually associated with forced liquidations rather than orderly selling, before dip buyers stepped in below $1.10.
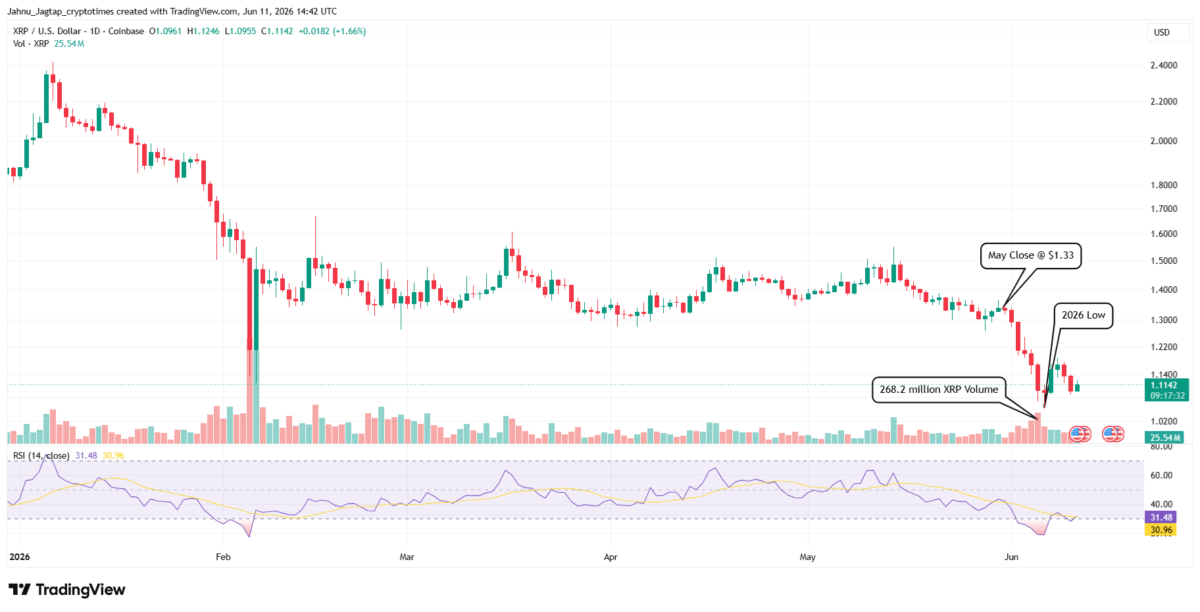
The June 5 wick carries weight beyond the day’s loss. The drop below February’s $1.11 floor — until last week the year’s structural low — makes this a new 2026 bottom, with TheStreet noting the level was last seen in November 2024.
The damage along the way was concrete. CoinGlass data showed more than $25 million in XRP liquidations in a single 24-hour window, 96% of them long positions, and the slide pushed XRP’s market cap below $75 billion — enough for USDC to overtake it as the fifth-largest cryptocurrency on CoinGecko’s rankings.
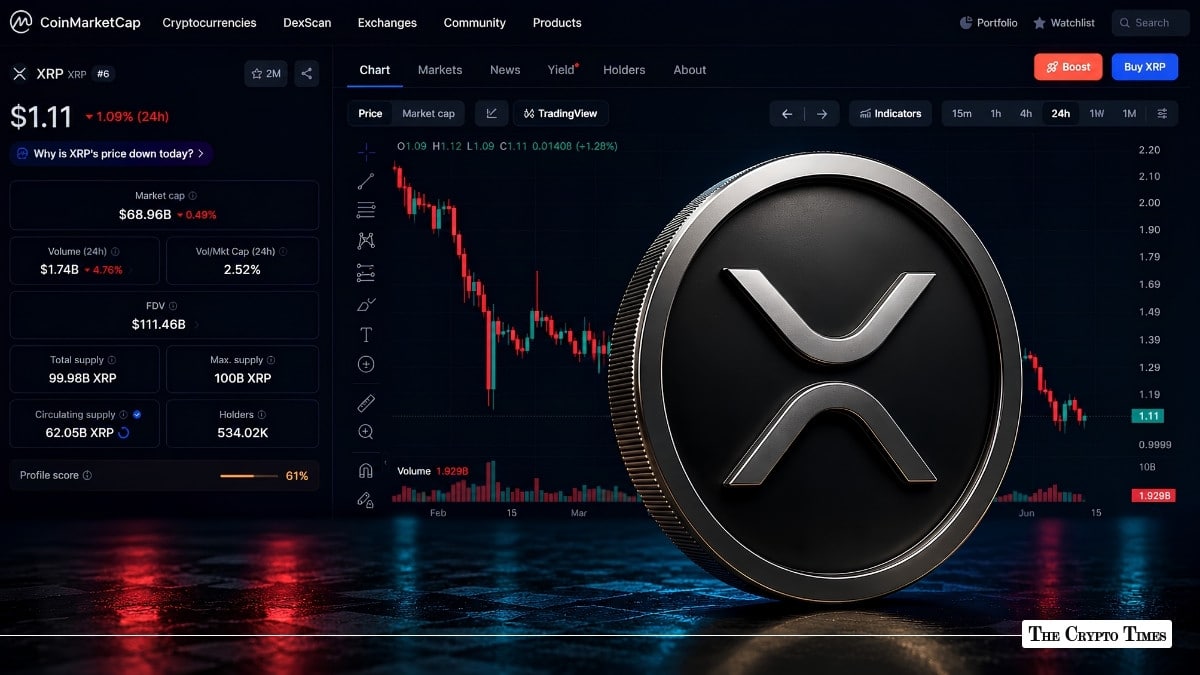
At press time, XRP trades near $1.12, down around 38% year-to-date and roughly 23% over the past month.
Why is XRP Down?
The largest driver is not XRP-specific. Bitcoin is down about 30% in 2026 to the low $61,000s amid record ETF outflows — a slide that accelerated after Strategy confirmed a partial sale of its Bitcoin holdings on June 1 — while Ethereum has lost roughly 45% and the total crypto market cap has slipped to $2.17 trillion with the Fear & Greed Index in extreme fear. When the market leader falls this hard, altcoins fall harder, and XRP has shown little independent strength to resist the current.
Two XRP-specific weights made the move worse. Ripple’s monthly escrow release put a fresh tranche of XRP into the market on June 1, just as sentiment was breaking down. And on-chain data points to profit-taking from large wallets that had been accumulating through 2024 and 2025.
ETF Inflows Have Lost Their Pricing Power
This is the part that makes the current decline unusual. Spot XRP ETFs have accumulated roughly $1.5 billion in inflows since launching in November 2025, and money kept arriving through the crash — about $4 million in fresh inflows landed on June 5 even as the price broke down.
The cracks are visible, though. SoSoValue data showed the products recorded their first daily outflow of June on June 3, a modest $5.35 million, before flows turned positive again the next day.
CoinDesk’s read on the pattern is blunt: XRP is no longer reacting positively to bullish supply data — falling exchange balances, steady ETF demand — and that behavior typically appears late in downtrends, when traders trade the chart rather than the fundamentals.
The CLARITY Act Is Close — and That’s the Problem
The Digital Asset Market CLARITY Act was placed on the Senate Legislative Calendar on June 1, after clearing the Senate Banking Committee 15-9 in May. Calendar placement makes the bill eligible for a floor vote, but no date has been scheduled, and passage requires 60 votes — meaning roughly seven more Democrats must cross over.
The timing is tight. Around eight weeks remain on the Senate calendar before the summer recess, the bill could consume up to a week of floor time, and it is competing with a stack of other legislation. Polymarket prices 2026 passage at 59%, while the White House has floated a July 4 signing target.
For XRP, the bill has become a catalyst that pays out later, not now. Until a floor date exists, regulatory momentum is a promise the market has already partially priced — and promises do not absorb sell pressure.
Oversold Extremes Are Flashing Cycle-Low Signals
The counter-case is building underneath the price. XRP’s weekly RSI fell below 30 during the June 5 selloff — a reading that, per analysis circulated by trader Dom Clegg, has occurred only once before in XRP’s entire history, and that single prior occurrence marked the bottom of that bear market. The caveat: the weekly RSI has spent most of 2026 below 35 without arresting the trend.
Accumulation data points the same direction. Whale wallets hit a record 332,230 addresses, more than 25 million XRP moved off exchanges in early June, and active XRP Ledger addresses touched a five-week high of 46,767 in mid-May.
The setup is a standoff: oversold extremes and quiet accumulation against a market that is currently ignoring both. With February’s $1.11 floor now broken, the next supports sit at $1.05 and the $1.00 psychological level, while $1.20 and the $1.32–$1.37 band are the levels XRP must reclaim before any recovery is credible.
Also Read: When Will Bitcoin Price Start Going Up?