
Key Highlights
- Bitcoin has dropped below the median holder breakeven level for the first time since December 2022.
- The next major support cluster sits near the Median Realized Price at $64,100 and the 200-week moving average at $61,700.
- CryptoQuant data shows 30-day realized losses near 187,000 BTC, still below previous panic levels seen after FTX and in February 2026.
Bitcoin (BTC) is trading near $62,100, showing a mild intraday recovery of about 0.6%–0.7% after dropping sharply earlier this month. However, the rebound is still weak compared with the scale of the recent selloff.
BTC has fallen to the $62K area, nearly 50% below its all-time high near $124,700 and down about 24% over the past month. That has shifted the market’s focus from upside momentum to one question: where does Bitcoin find a bottom?
On the daily chart, BTC remains below all major moving averages. The 20-day SMA is near $69,450, the 50-day SMA is around $75,032, the 100-day SMA is near $72,879, and the 200-day SMA stands around $78,143. This shows that Bitcoin is still trading inside a broader bearish structure, even though price has stopped falling aggressively for now.
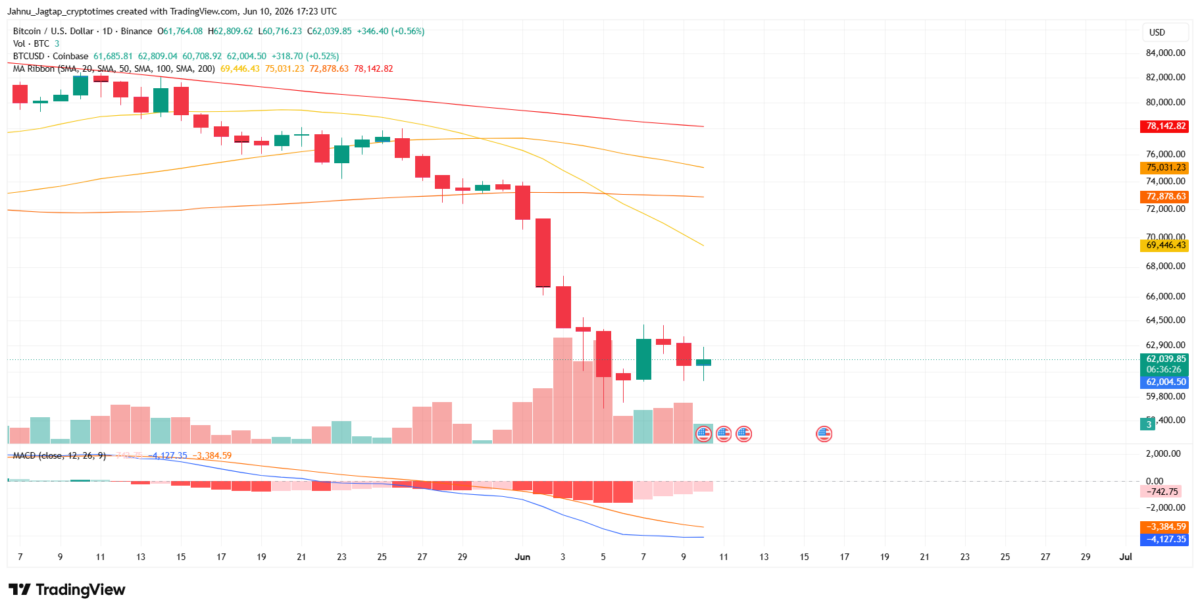
The latest candles show Bitcoin trying to stabilize around the $60,700–$62,800 range after briefly testing levels below $61,000. But the market has not yet confirmed a trend reversal. BTC needs to reclaim at least the $64,000–$65,000 zone first to show that buyers are gaining control again.
Momentum also remains weak. The MACD is still negative, with the MACD line below the signal line, although the histogram is beginning to shrink. That suggests downside pressure may be slowing, but not yet fully reversing.
This makes the current setup a bottom-testing phase rather than a confirmed recovery. Bitcoin is no longer in freefall, but it is still trading below key trend levels and remains vulnerable unless buyers defend the $61,000–$60,700 support area.
This is why the next few sessions are important. Bitcoin is now sitting near the same area where on-chain breakeven levels, realized-loss signals, and long-term moving averages are all converging.
CVDD Ratio Shows Bitcoin Is Nearing a Bottom Zone
Glassnode co-founder Rafael Schultze-Kraft’s latest CVDD chart shows Bitcoin’s CVDD/Price Ratio at 0.73 and climbing. In previous cycle lows, this ratio moved closer to 1 as Bitcoin’s price approached the CVDD floor.
The ratio peaked near 0.90 in 2015, 0.91 in 2018, and 0.95 in 2022. Those readings appeared when Bitcoin was much closer to its long-term valuation floor and the market had moved through deeper capitulation.
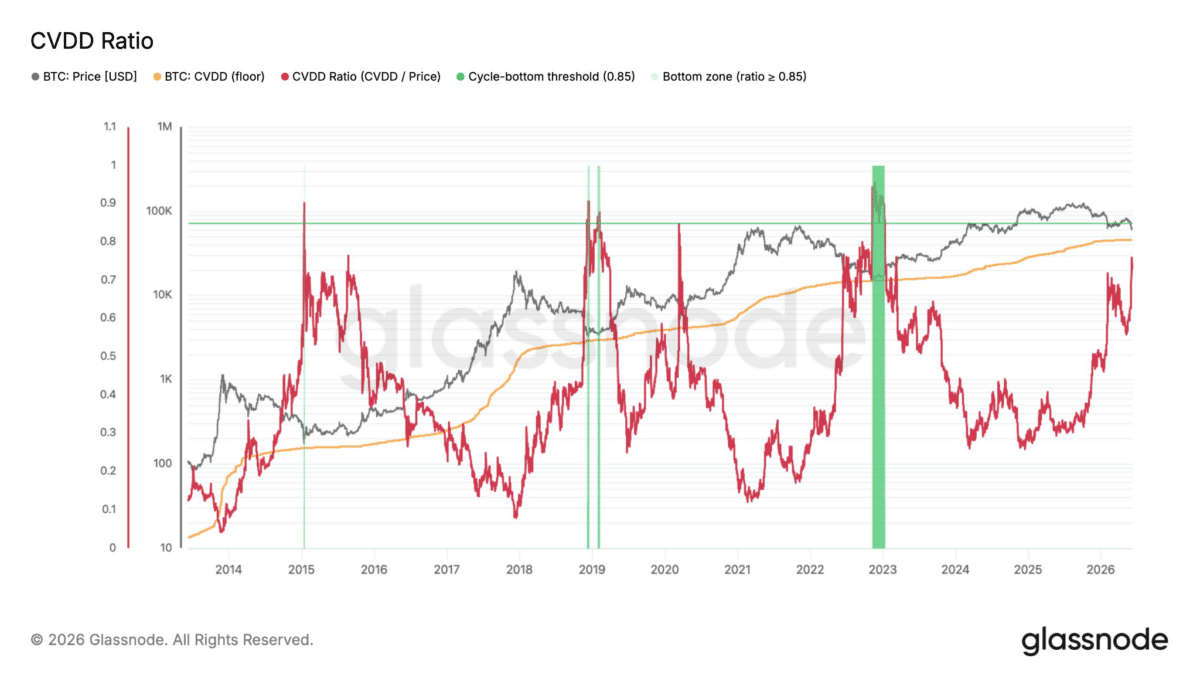
CVDD, or Cumulative Value Days Destroyed, is used by some analysts as a long-term Bitcoin valuation floor. It tracks old coin movement and attempts to identify deep-value zones where heavy selling has already pushed the market close to historical bottom levels.
The current CVDD floor is near $46,000. With the CVDD/Price Ratio at 0.73, Bitcoin has moved closer to this floor, but it has not yet reached the same ratio zone seen at previous major cycle bottoms.
If the ratio follows earlier cycle-bottom behavior and moves toward the 0.90–0.95 range again, the implied bottom zone would sit around $52,000 to $59,000.
That does not mean Bitcoin must fall there. However, it explains why calling a confirmed bottom at $62K may still be early. The market has entered a deeper support region, but the CVDD model suggests there may still be room for one final flush before a durable recovery begins.
Rafael also noted that a repeat of past timing patterns would place the cycle low roughly 12 to 13 months after the October 2025 all-time high. That points toward Q4 2026 as a possible bottoming window if Bitcoin follows earlier cycle behavior.
Bitcoin Still Lacks Full Capitulation Signal
CryptoQuant’s latest data adds another layer to the picture. According to the firm, Bitcoin’s correction still lacks full capitulation.
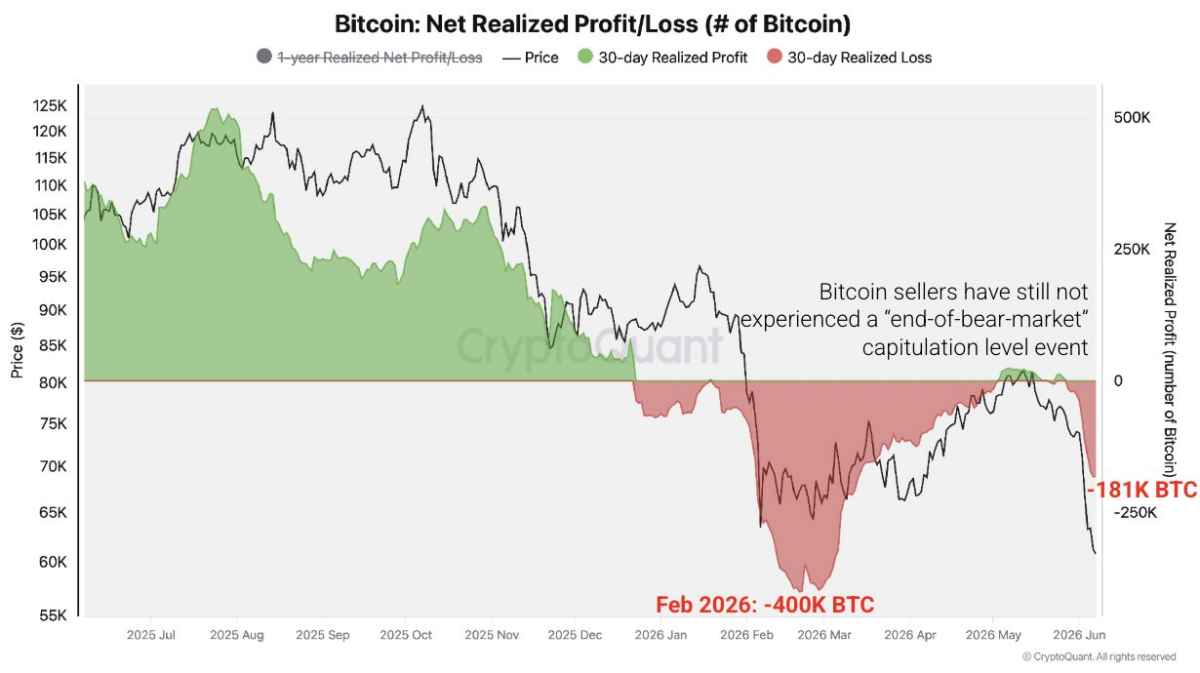
Realized losses reached around 187,000 BTC over the last 30 days. That is a heavy loss figure, but it remains below the roughly 400,000 BTC panic seen in February 2026 and far below the 1.2 million BTC spike recorded after the FTX collapse.
This matters because major Bitcoin bottoms often form after forced selling reaches exhaustion. In simple terms, weak hands need to sell, leveraged traders need to be flushed out, and long-term buyers need to absorb the supply.
CryptoQuant’s chart suggests that this process has started but may not be complete yet. The realized loss curve has turned sharply negative, but it has not yet reached the deeper panic zones that previously marked stronger bottom signals.
That means Bitcoin may need either more time moving sideways near support or one final washout before a sustainable uptrend begins.
When Will Bitcoin Start Going Up?
Bitcoin is more likely to start going up when three conditions appear together.
First, BTC needs to reclaim the $64,000 to $65,000 zone. This would show that buyers are regaining control after the sharp drop and that the latest bounce is more than just a relief move.
Second, Bitcoin must defend the $61,000 to $60,700 support area. If this zone breaks cleanly, the market could move toward the $52,000–$59,000 range suggested by the CVDD/Price Ratio.
Third, realized losses need to slow. If losses remain high but stop expanding, it would suggest seller exhaustion is beginning. That would be a stronger signal than a short-term bounce alone.
Until these conditions appear, the market remains fragile. Bitcoin can bounce from oversold levels, but a sustainable uptrend needs confirmation from both price structure and on-chain data.
What Traders Should Watch Next
The first level to watch is $64,000 to $65,000. A daily close above this zone would be the first sign that Bitcoin is trying to recover from the latest selloff.
The next resistance area sits near $69,450, where the 20-day SMA is currently placed. If BTC can move above that level, the recovery attempt would look stronger.
On the downside, $61,000 to $60,700 is the immediate support area. A loss of this zone would keep the risk of a deeper move alive.
If selling accelerates, the next major zone to watch is $52,000 to $59,000. This range comes from the CVDD/Price Ratio setup and would become more relevant if Bitcoin moves closer to its long-term CVDD floor near $46,000.
Bitcoin Is Near Support, But Not Yet in Recovery
Bitcoin’s current setup is not fully bearish and not fully bullish. It is a bottom-testing structure.
The price has stabilized near $62K after a sharp decline, while the CVDD/Price Ratio shows BTC moving closer to historical cycle-bottom territory. At the same time, CryptoQuant’s realized-loss data shows that full capitulation has not yet arrived.
That means Bitcoin may be near the zone where a bottom starts forming, but the market has not confirmed that the bottom is already in.
A reclaim of $64K–$65K would improve the recovery case. A break below $60.7K would keep the risk of a move toward $52K–$59K alive.
For now, the answer to “when will Bitcoin start going up?” is clear: Bitcoin needs to reclaim short-term resistance, defend current support, and show that seller exhaustion has finally arrived.
Also Read: Crypto Market Today: BTC & ETH Holds Price XRP Stays Weak, ETFs Bleed Again