
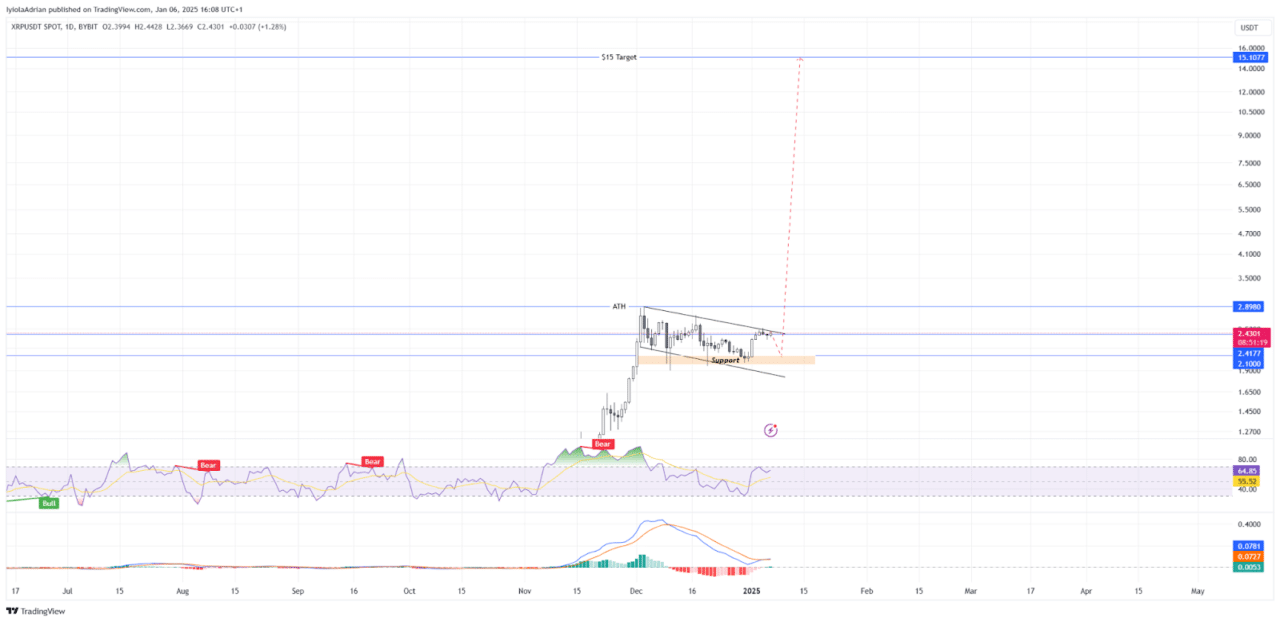
XRP has formed a “bull flag” on its daily chart, which suggests a breakout might be coming soon. Right now, XRP is trading at $2.44, up 1.5% in one day, after rising 15% over the last week.
This increase follows a consolidation period after hitting $3.00 in December 2024, according to data from Tradingview.
Meanwhile, data from CoinGlass shows that there is a sharp rise in open interest (OI) which has spiked 45% in the last 24 hours, surging from $2.6 billion to $3.7 billion. Increases in OI generally reflect more investors becoming active and gaining confidence in a particular token.
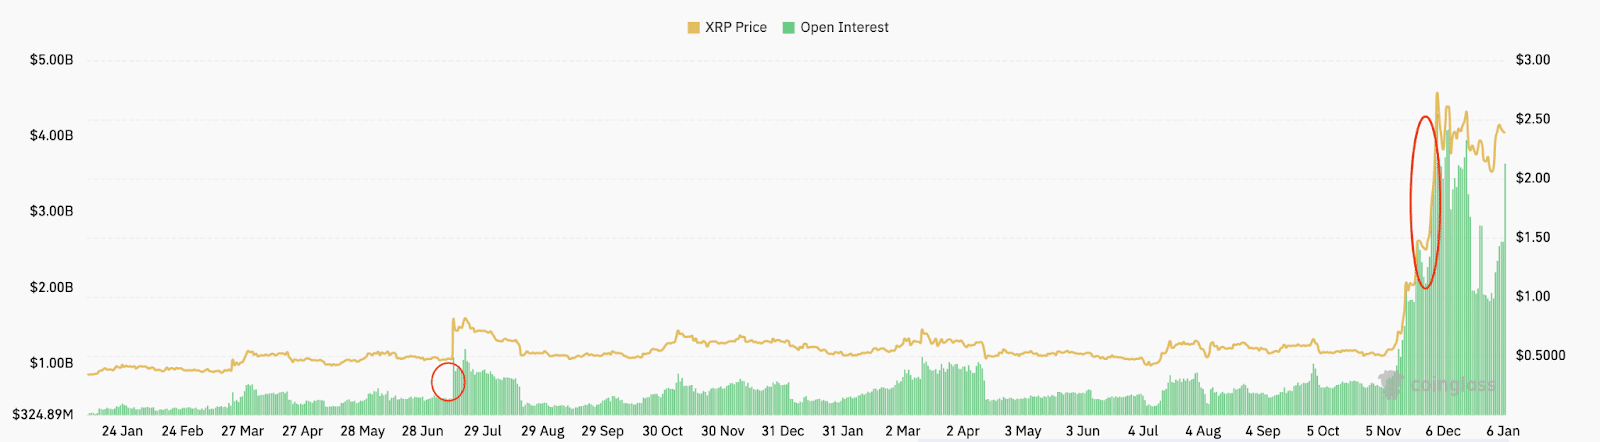
Past trends have indicated that large spikes in OI occur before significant price increases. For example, OI doubled in July 2023, when prices surged by 107%. Another OI surge of 76% in late 2024 was followed by a 100% price rally.
XRP Bull Flag: Ready for a Breakout?
The bull flag pattern on XRP’s daily chart simply hints that the cryptocurrency may be on the verge of a breakout.
The confirmation of the pattern would come at the close of above $2.41, which is at the top of the flag and should increase in price to $15 based on the height of the flagpole. This would be a 520% move from its current price.
The closest support is located at $2.10, while confirmation of a long-term uptrend is found at $2.60.
XRP’s Network activity is also on the rise, with active XRP addresses increasing by 1.16% in the past 24 hours to reach 37,847K, as reported by CryptoQuant.
Concurrently, exchange reserves have dropped by 0.15%, signalling reduced selling pressure as investors move XRP into long-term holdings. The derivatives market reinforces a bullish outlook, with trading volume rising by 66.10% and options volume surging by 339.80%.
Fibonacci Forecast: $15 by May 2025
Analysts like Egrag Crypto have also predicted this $15 price target for XRP by May 2025, which he posted in a Dec. 30 tweet while leveraging Fibonacci time zones and Elliott Wave theory. According to his chart, the 1.618 Fibonacci level aligns with May 2025 as a key date.
But, despite bullish indicators, technical metrics such as the RSI at 55.52 suggest neutral momentum, while the MACD displayed a bearish crossover, hinting at a short-term bearish move.
Also Read: Pro XRP lawyer offers to Probe Operation Chokepoint 2.0