
XRP, the native token of the XRP Ledger, fell on Thursday, 24 September 2026, giving back part of the gains it built earlier in the week. The decline came even as U.S. spot exchange-traded funds (ETFs) tied to the token continued to attract new capital, a split that shows regulated fund demand and open market trading do not always move in the same direction.
XRP Price Falls 8.5% in 24 Hours
XRP traded at $1.46 as of 10:11 UTC on 24 September 2026 (15:41 IST), down 8.5% over 24 hours, according to CoinGecko data. Against Bitcoin (BTC), the token stood at 0.00001755 BTC, down 5.6% over the same period.
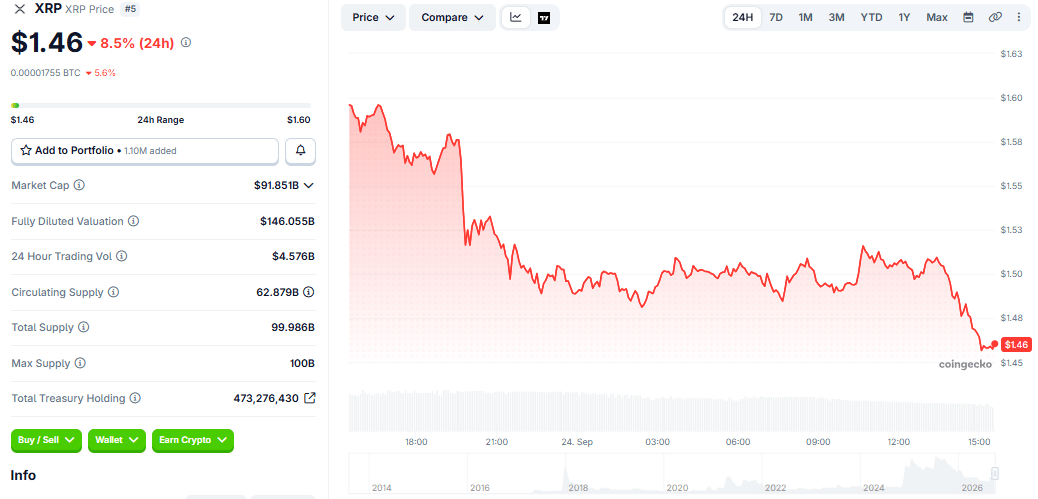
The 24-hour range ran from a high of $1.60 to a low of $1.46, which means XRP was trading at the bottom of its daily range at the time of the snapshot. XRP’s market capitalization, the total value of all circulating tokens at the current price, fell to $91.851 billion. Trading volume over 24 hours reached $4.576 billion, and XRP ranked fifth among cryptocurrencies by market capitalization.
How the XRP Sell-Off Unfolded
The CoinGecko 24-hour price chart shows the decline played out in three stages. All times below are in IST with UTC in brackets.
XRP traded close to $1.60 in the late afternoon of 23 September. The first sharp break came at around 19:45 IST (14:15 UTC), when the price dropped from roughly $1.58 to about $1.52 in a short span.
Through the night and into the morning of 24 September, XRP moved sideways between roughly $1.49 and $1.52. Buyers attempted a recovery at around 11:00 IST (5:30 UTC), lifting the price back toward $1.52, but the move did not hold.
The final leg lower began after about 13:45 IST (8:15 UTC). XRP broke below $1.48 and reached $1.46 by around 15:00 IST (09:30 UTC).
The $1.60 area had already been tested earlier in the week. On 22 September, The Crypto Times reported that XRP was trading around $1.56 with an intraday range of about $1.48 to $1.59. The latest rejection near that zone marked a second failed attempt to establish the price above it.
Spot XRP ETFs Still Recorded Net Inflows
An exchange-traded fund (ETF) is an investment fund listed on a stock exchange that lets investors gain exposure to an asset through a regular brokerage account. A spot XRP ETF holds actual XRP tokens rather than futures contracts.
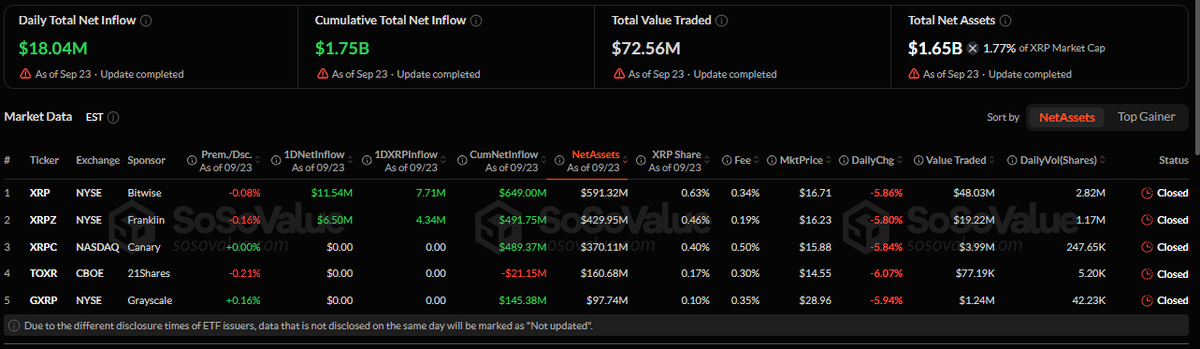
According to the SoSoValue U.S. crypto spot ETF dashboard, U.S. spot XRP ETFs recorded a total net inflow of $18.04 million on 23 September 2026, Eastern Time (ET). The Bitwise XRP ETF, which trades under the ticker XRP, led with $11.54 million, taking its cumulative net inflow to $649 million. The Franklin XRP ETF (XRPZ) added $6.50 million, lifting its cumulative total to $492 million.
Total net asset value (NAV), the combined market value of the assets held by the funds, stood at $1.65 billion, equal to 1.77% of XRP’s market capitalization. Cumulative net inflows since launch reached $1.748 billion.
The previous session was stronger. SoSoValue data for 22 September showed $20.02 million in net inflows, with the Bitwise XRP ETF accounting for $19.16 million of that total. Net assets at that time stood at $1.731 billion.
Between the two reports, total net assets fell from $1.731 billion to $1.65 billion even though the funds took in new money. This is consistent with the lower XRP price reducing the value of the tokens the funds already hold.
Why ETF Inflows Did Not Stop the Drop
The size of the two markets explains much of the gap. The $18.04 million ETF inflow on 23 September equals roughly 0.4% of XRP’s $4.576 billion in 24-hour spot trading volume. The two figures cover slightly different windows, since ETF data reflects one U.S. trading day in ET while CoinGecko volume is a rolling 24-hour total, so the comparison is approximate. Even so, it shows that daily fund buying can be absorbed by a much larger volume of selling on spot exchanges.
CoinGecko’s market note pointed to profit-taking as the session’s main explanation. XRP climbed from around $1.29 to about $1.38 on 18 September as whale inflows to Binance reached a six-month high, then pushed toward $1.60 over the following days. Holders who bought during that run were in a position to sell once the price stalled below $1.60. That is market context, not proof of any single trader’s intent.
On-chain data adds further context. On 23 September, analytics firm Santiment said XRP’s 365-day Market Value to Realized Value (MVRV) ratio stood at around -11.75%. MVRV compares an asset’s current market value with the average price at which its coins last moved on-chain. A negative reading means the average trader active over the past year is holding at a loss.
When many holders sit below their entry price, rallies can draw selling from traders looking to reduce losses. This is one possible explanation, and the data alone does not confirm the reason behind individual trades.
XRP Supply and Valuation Data
The session’s move reflects trading activity, not a change to XRP’s supply structure. CoinGecko data showed the following figures at the time of the snapshot:
- Circulating supply: 62.879 billion XRP
- Total supply: 99.986 billion XRP
- Maximum supply: 100 billion XRP
- Fully diluted valuation (FDV): $146.055 billion
- Total treasury holding: 473,276,430 XRP
Fully diluted valuation (FDV) is the theoretical market value of XRP if the entire maximum supply were in circulation at the current price. The treasury figure is the amount of XRP that CoinGecko tracks as held by companies and institutions on their balance sheets.
Key XRP Price Levels to Watch
Three levels defined the session. $1.60 was the failed high, $1.50 was the round-number level XRP lost, and $1.46 was the 24-hour low at the time of the snapshot.
Earlier this month, The Crypto Times identified $1.50 to $1.55 as a major resistance zone that XRP had yet to break. The token later moved above that band, and the current question is whether it can return there after this pullback. On the downside, recent Crypto Times coverage noted $1.45 and $1.40 as nearby support levels, followed by the $1.30 to $1.35 region.
These levels are reference points drawn from recent trading, not forecasts of the next move.
Other XRP Developments This Week
The price drop came during an active week for the wider XRP ecosystem. The XRP Ledger (XRPL) is moving closer to native lending, as two proposed amendments, XLS-65 and XLS-66, go through validator voting. Neither is active on the XRPL mainnet yet. Separately, Evernorth is advancing toward a Nasdaq listing under the ticker XRPN after its Form S-4 registration statement took effect.
Neither development was linked to Thursday’s price move in the available data. It is also worth noting that Ripple is a U.S.-based blockchain payments company, while XRP is the native token of the XRP Ledger, an open-source public blockchain. The two are connected but separate.
What the Data Shows
The data shows XRP fell 8.5% in 24 hours after failing to hold near $1.60, with market capitalization dropping to $91.851 billion on $4.576 billion in trading volume. It also shows U.S. spot XRP ETFs remained in net inflow on both 22 and 23 September, with cumulative inflows near $1.75 billion.
The data does not show that ETF demand has stopped, and it does not show a full reversal of the recent recovery, since XRP is still trading above its 18 September level. The next sessions of ETF flow data and spot trading volume will show whether this was a short pullback or the start of a deeper retracement.
Also Read: Bitcoin Price Slips From $87,000 as Short-Term Holders Lock In Gains