
Key Highlights
- Bitcoin remained relatively stable near $63,885 despite reports that Iran closed the Strait of Hormuz again.
- The renewed geopolitical tensions raised concerns over global oil supply and broader financial market stability.
- BTC’s muted reaction suggests growing resilience and possible decoupling from traditional risk-off market behavior.
Bitcoin’s precarious consolidation near $62,350 has crypto traders on edge, with mounting fears that a prolonged blockade of the Strait of Hormuz could trigger a severe, macro-driven market crash.
At the press time, BTC has remained largely unaffected, holding steady within its recent consolidation range; however, a short sell-off can trigger a huge crash as the price is testing a key support right now.
Why the conflicted path is closed again
According to a BBC report, the Iranian military has announced the closure of the Strait of Hormuz, blaming America’s “blatant breach of promise” regarding the 14-point deal aimed at ending the war. Iran specifically pointed to the first paragraph of the agreement, which calls for the “immediate and permanent termination of military operations on all fronts, including in Lebanon.”
A US official stated yesterday that Israel and Hezbollah had agreed to a ceasefire. The Israeli military initially confirmed the ceasefire was in effect, but a spokesman later clarified that its forces would “continue to remove immediate threats.”
How the closure has affected the market historically
The closure of the Strait of Hormuz by Iran introduces significant uncertainty for global energy markets and traditional risk assets. Historically, such events trigger flight-to-safety flows into gold and the US dollar. However, Bitcoin’s muted reaction underscores its evolving role as a non-sovereign asset less tied to immediate geopolitical shocks. Institutional inflows and ETF momentum appear to be providing underlying support.
Bitcoin, along with other major cryptocurrencies, has also been heavily affected by the previous closures, witnessing major price falls.
What does 4-hour chart reveals
The 4-hour BTC/USD chart reveals a volatile but contained structure. The asset fell around 2.40% in this time frame from $62,348 to the current level. A critical level to watch is the Simple Moving Average (SMA) 100.
If the SMA fails to act as a support, with the current fear level of the market, bitcoin can quickly drop down to $60,000 to $61,000 range.
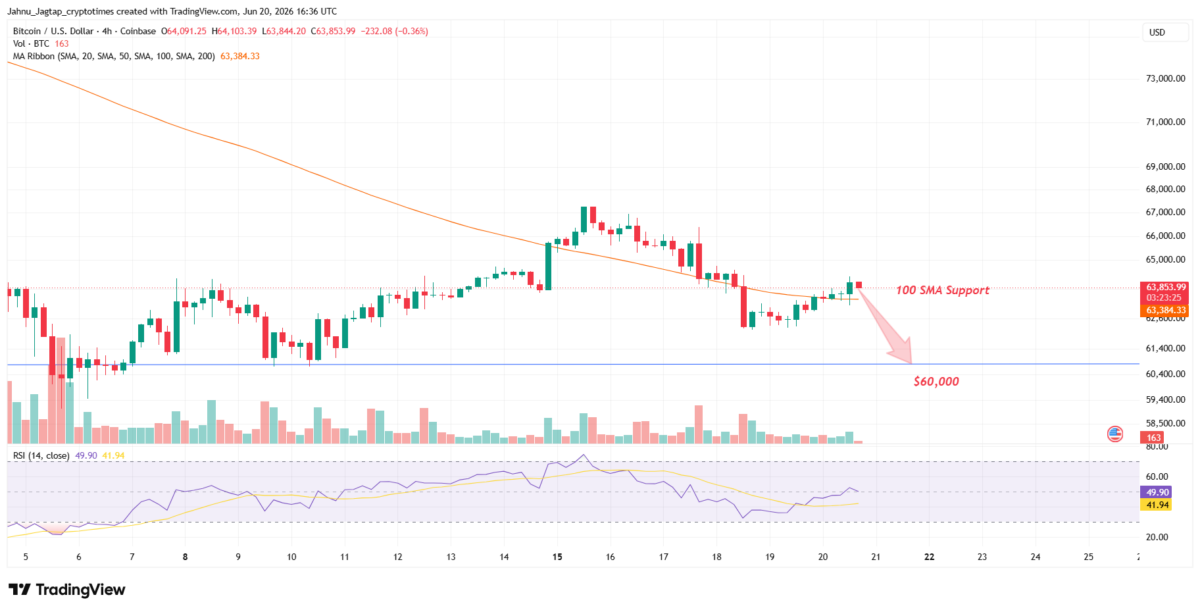
The chart displays alternating green and red candles, reflecting indecision. Recent price action shows lower highs and higher lows within a tightening range, suggesting building tension ahead of a potential breakout or breakdown. Volume remains moderate, with no extreme spikes indicating panic selling despite the geopolitical headlines.
Technical picture reveals short-term bearish pressure
From a technical viewpoint, multiple moving averages (EMA 10, SMA 20, EMA 50, etc.) are positioned above the current price, signaling short-term bearish pressure.
Currently acting as dynamic support near the $63,500–$63,800 zone, this level has been tested multiple times in recent sessions. If the SMA 100 support fails to hold, it could lead to a deeper correction toward the psychological $60,000 level.
The Awesome Oscillator and MACD show weakening momentum, while the Relative Strength Index (RSI) hovers in neutral territory around 34.42, avoiding oversold conditions for now.
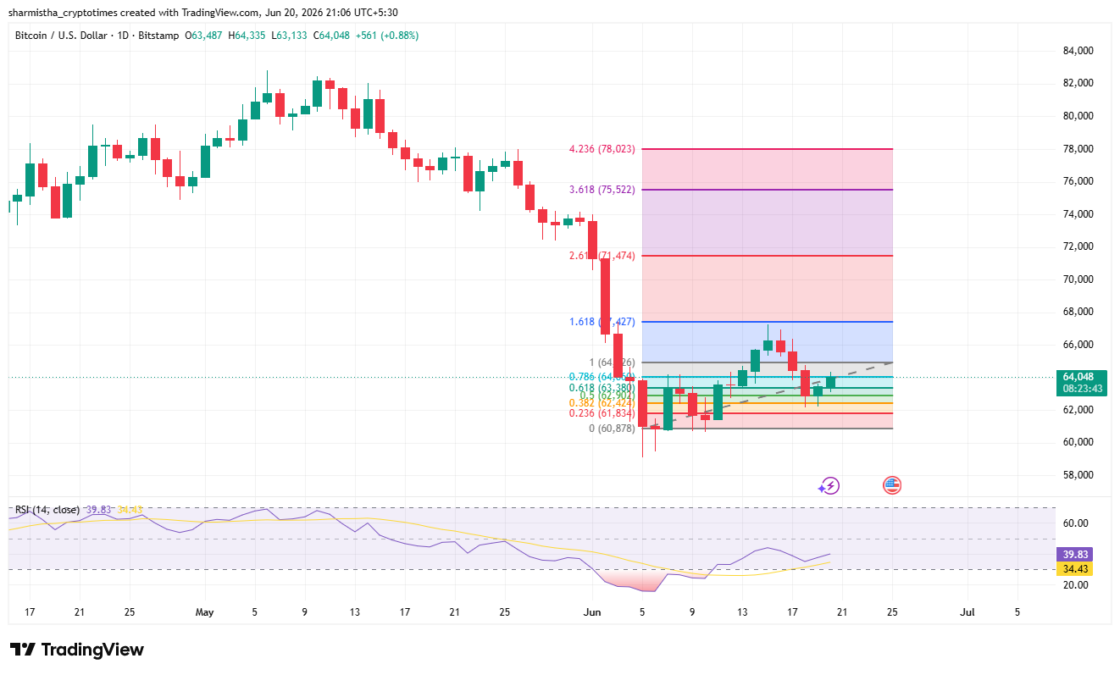
On a longer timeframe, at a one-month Fibonacci scale, the immediate support sits at $66,265. If the price fails to close above it by month end, selling pressure could push the price toward $64,031 and potentially the major psychological support at $44,229.
On the upside, the first resistance zone lies between $115,869 and $128,103. Stronger resistance awaits at $147,905.
Also Read: How a Custom Code Flaw Cost Secret Network $4.67 Million