Key Highlights
- Bitcoin (BTC) snapped a punishing five-month losing streak in March 2026 — its first green monthly candle since August 2025 — closing around $68,215 with a modest ~2% gain, ending the longest run of consecutive red months since the 2018 bear market.
- Following a brutal correction from October 2025’s all-time high of around $126,198 down to near $60,000, March’s rebound stands out against Bitcoin’s strong historical seasonality (March averages +11.47%, November +41.12%). Such extended weakness often signals major capitulation phases, raising hopes that this could mark a turning point.
- Despite the green candle, BTC remains well below its 20- and 50-period EMAs on the monthly chart, with RSI at 44.49 showing waning momentum. Bulls need a decisive break above $70,000–$75,900, while bears eye critical support at $65,000–$67,000 amid persistent “extreme fear” sentiment and mixed institutional flows.
Bitcoin snapped a punishing five-month losing streak in March, posting its first green monthly candle since August 2025 and closing the period around $68,215.
The modest gain of roughly 2% came after a brutal correction that saw the cryptocurrency slide from its all-time high of about $126,198 in October 2025 to lows near $60,000 earlier this year.
For many traders and analysts, the shift ends the longest string of consecutive red monthly closes since the 2018 bear market. Bitcoin (BTC) dominance held steady near 58%, while the broader crypto market cap lingered around $2.4 trillion amid persistent “extreme fear” readings on the Fear & Greed Index—the longest such streak since the FTX collapse.
The 1-month chart from TradingView shows that BTC price remains well below the 20-period EMA ($82,176) and 50-period EMA ($65,648), signaling that the broader uptrend from 2024–2025 has cooled into a consolidation phase, with the 200-period EMA ($46,900) still acting as distant long-term support.

The 14-period relative strength index (RSI) stands at 44.49 (below the signal line at 59.33), hovering in neutral-to-oversold territory without clear bullish divergence, which suggests waning momentum and room for further downside pressure if key supports break.
Given the easing macro-pressure pushing BTC price higher, immediate resistance lies near the March local high of approximately $75,900 and the descending 50 EMA, while critical support rests at $65,000–$67,000; a decisive hold above the latter could allow a retest of higher EMAs, but failure risks a deeper pullback toward the $60,000–$61,500 zone in the weeks ahead.
After peaking in October 2025, Bitcoin endured steady pressure through the winter, with January and February both closing lower. March’s rebound, while positive, left prices trading well below the 2025 summit and failed to erase the bulk of the drawdown.
Bitcoin’s historical monthly returns
While Bitcoin has delivered strong average monthly gains historically (with March averaging +11.47% and November leading at +41.12%), periods of sustained weakness like late 2025 into early 2026 are infrequent but often mark significant capitulation phases.
This modest rebound in March stands out as a potential turning point, especially when viewed against the backdrop of deeper drawdowns seen in prior cycles.
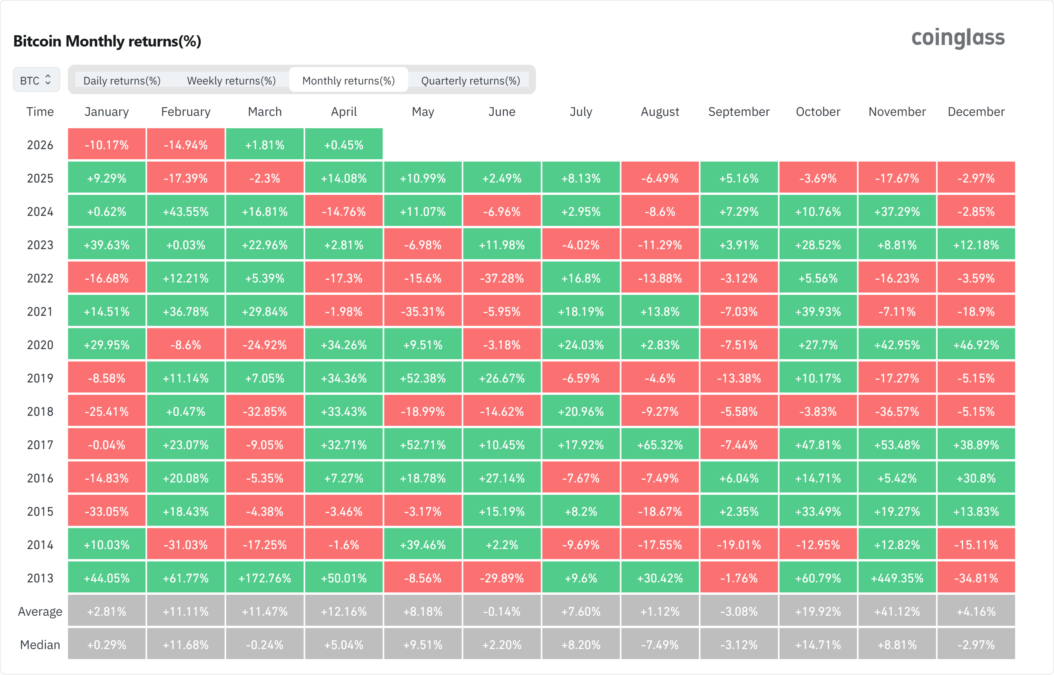
Seasonality remains evident in Bitcoin’s historical performance. Strong months such as October (+19.92% average) and November (+41.12% average) contrast with more mixed results in February and September.
The 2026 data so far shows continued volatility, with January and February posting notable losses of -10.17% and -14.94%, respectively, before March’s green candle provided relief. As April begins with a small positive return of around +0.45%, traders will be watching whether this ends the winter consolidation or merely delays deeper tests of support.
Historically, green months following extended red streaks have sometimes preceded powerful recovery rallies, though current technicals and persistent “extreme fear” sentiment suggest caution in the near term.
As April begins, attention has turned to key levels. Bulls will watch for a decisive move above $70,000 to confirm shifting sentiment, while bears eye support near $65,000–$67,000. On the institutional side, spot Bitcoin ETFs recorded solid but tapering inflows in Q1, and institutional buying has been mixed.
With volatility still elevated and positioning relatively healthy following last year’s leverage flush, the coming weeks could clarify whether March marked the bottom of the correction or merely a pause in the downtrend. For now, the market is watching closely—hoping the first green month in six signals more than just temporary respite.
As April begins, attention has turned to key levels. Bulls will watch for a decisive move above $70,000 to confirm shifting sentiment, while bears eye support near $65,000–$67,000. On the institutional side, spot Bitcoin ETFs recorded solid but tapering inflows in Q1, and institutional buying has been mixed.
With volatility still elevated and positioning relatively healthy following last year’s leverage flush, the coming weeks could clarify whether March marked the bottom of the correction or merely a pause in the downtrend. For now, the market is watching closely—hoping the first green month in six signals more than just temporary respite.
Also read: 21% Above Realized Price: Bitcoin’s Tightest Margin Since 2022 Bear Market