Key Highlights
- As of early April 2026, Bitcoin trades at ~$68,500, only 21% above its realized price of $54,286 — the narrowest gap since the 2022 bear market depths, signaling a sharp compression from the 120% premium seen at the late 2024 peak above $119,000.
- Newer 2026 buyers sit underwater with a cost basis near $77,000, while 2023 long-term holders maintain a comfortable ~$63,700 basis. Short-term holders face even higher stress near $85,800, highlighting a market split between seasoned holders and recent entrants.
- The realized price continues to act as a key support proxy. Stronger institutional ETF inflows provide a floor absent in prior cycles, but rising real rates and thin liquidity add volatility. This orderly deleveraging may lead to quiet accumulation or set up for further downside depending on macro conditions ahead.
Bitcoin’s on-chain metrics are flashing a signal that hasn’t been seen in three years: the gap between its current trading price and the average cost basis of all coins in circulation has narrowed sharply.
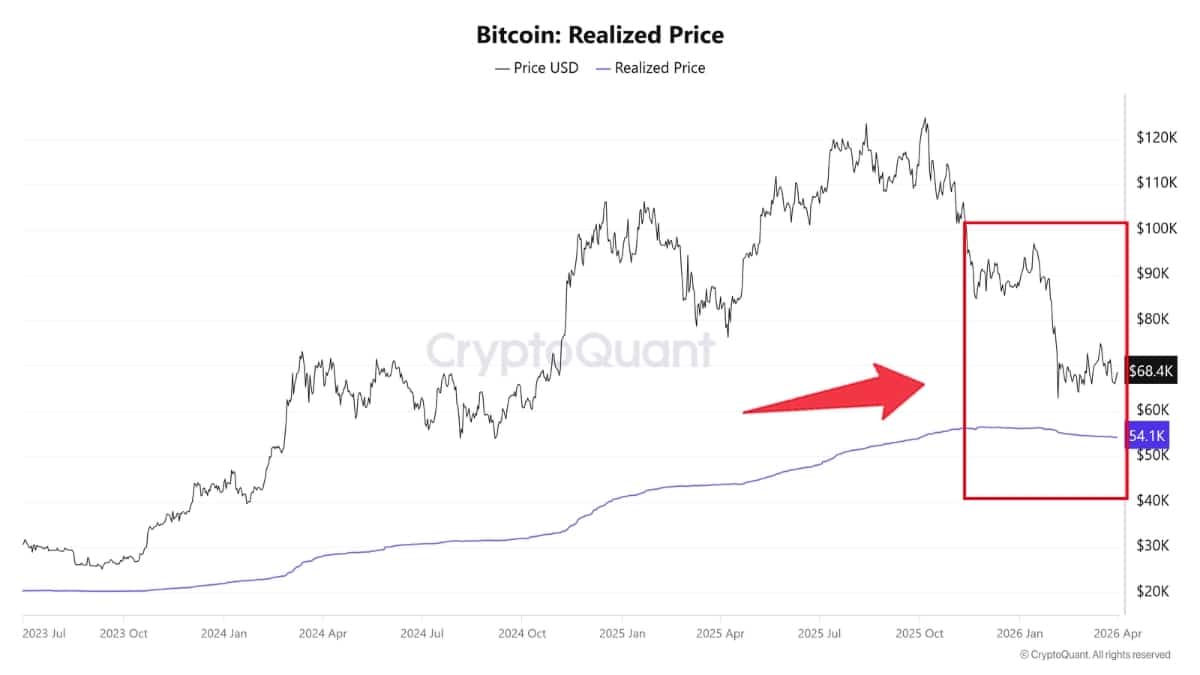
As of early April 2026, Bitcoin is trading around $68,500—as per CoinMarketCap data. This is roughly 21% above its realized price of $54,286, according to data from CryptoQuant. That premium is the tightest since the depths of the 2022 bear market, when spot prices frequently dipped at or below the realized level during heavy accumulation.
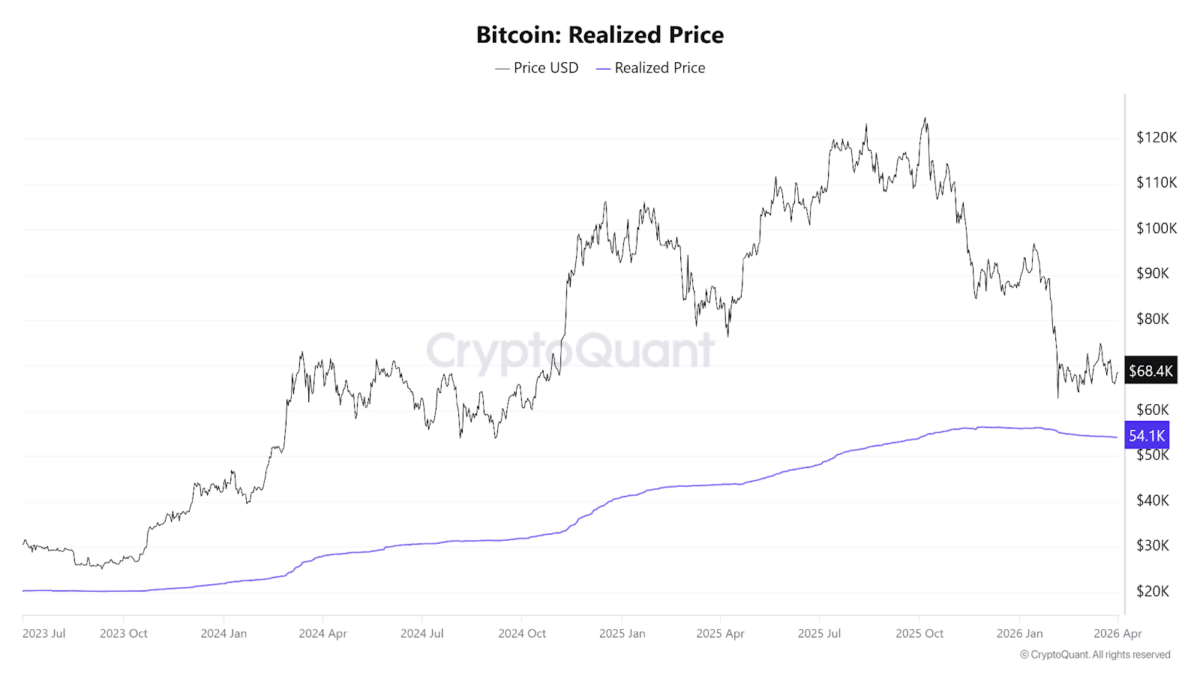
The realized price—calculated by dividing Bitcoin’s realized capitalization (the sum of every coin valued at the price when it last moved on-chain) by circulating supply—serves as a proxy for the market’s collective cost basis.
When the spot price sits well above it, most holders are in profit. When it falls below, widespread unrealized losses often trigger capitulation and set the stage for new buying.
In late 2024, as Bitcoin surged past $119,000, the premium to realized price ballooned to about 120%. The rapid compression since then reflects a market that has shed some froth without a full-blown crash. Analysts note that true cycle bottoms have historically involved price testing or breaching the realized level, often over extended periods of sideways action and fear.
Historical context and cycle comparisons
This current compression echoes patterns from previous Bitcoin cycles, particularly the prolonged 2022 bear market. Back then, the realized price acted as a dynamic support zone during months of accumulation amid widespread fear, capitulation, and low trading volumes. Prices repeatedly tested or dipped below the realized level before eventually forming a base for the subsequent bull run that propelled Bitcoin to new all-time highs.
In contrast to past cycles, however, the 2026 environment features stronger institutional participation. Spot Bitcoin ETFs have continued to attract inflows, providing a potential price floor that was absent in earlier downturns.
Despite this, macroeconomic headwinds—such as rising real interest rates and periods of thin liquidity—have contributed to heightened volatility throughout the year. Bitcoin has experienced several sharp corrections, yet it has avoided the deep, multi-month crashes seen in 2018 or 2022.
The rapid decline in the premium from over 120% in late 2024 to the current 21% highlights a market that has cooled significantly after the euphoric highs. This deleveraging phase has occurred without triggering mass liquidations, suggesting a more orderly reset rather than panic-driven selling.
Cohort analysis: Diverging cost bases
Cohort-specific realized prices reveal important nuances in holder behavior. Newer buyers who entered in 2026 currently sit underwater, with their average cost basis around the $77,000 mark. This group faces unrealized losses, which can lead to increased selling pressure if prices fail to recover quickly.
By comparison, longer-term holders from 2023 enjoy a much lower cost basis near $63,700. This cohort has provided notable support during recent dips, with Bitcoin finding stability around that level in earlier 2026 corrections. Even older accumulators from 2022 and prior maintain significantly lower bases, reinforcing the overall profitability of the broader market.
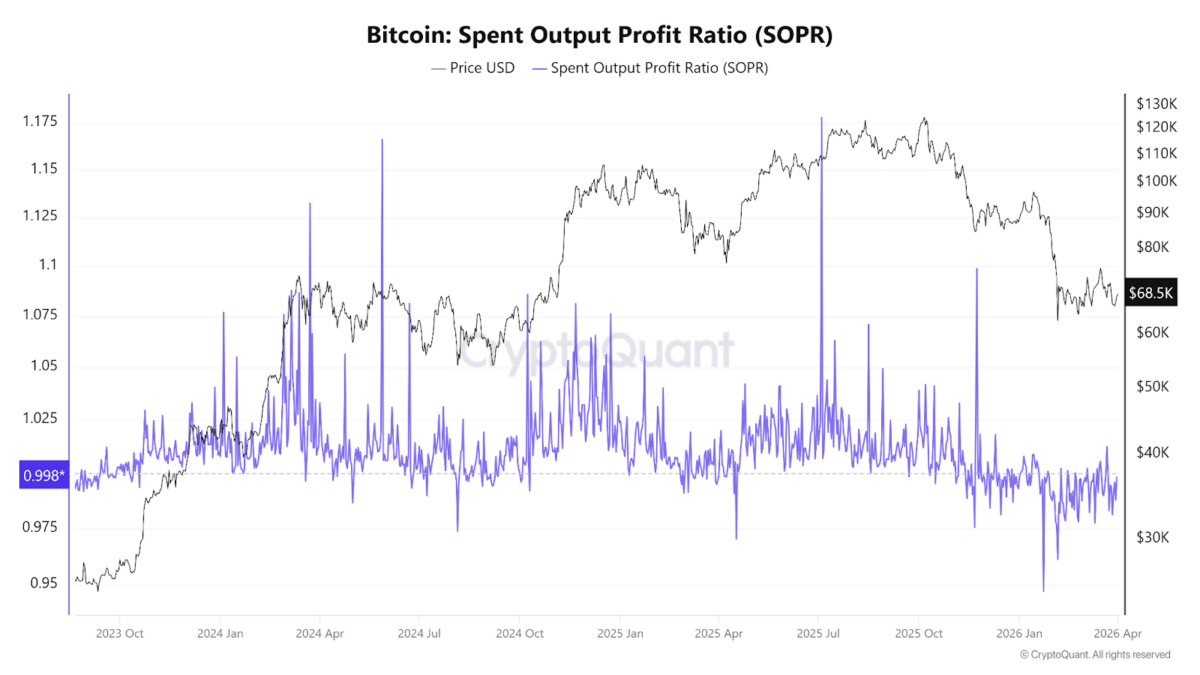
Short-term holders (STH), meanwhile, show signs of stress, with their realized price hovering well above current spot levels (around $85,800 in recent data). This divergence between cohorts underscores a market in transition: long-term conviction remains intact, while more recent entrants feel the pinch.
For now, the data suggests a market in transition rather than outright distress. Most holders remain profitable, but the margin for error has shrunk. Whether this compression foreshadows a quiet accumulation phase—similar to post-2022—or sets up for another leg lower will likely depend on macroeconomic conditions, ETF flows, trading volumes, and overall risk sentiment in the weeks ahead.
Also read: Ethereum’s Justin Drake in Spotlight Over Google Quantum Paper on Bitcoin