
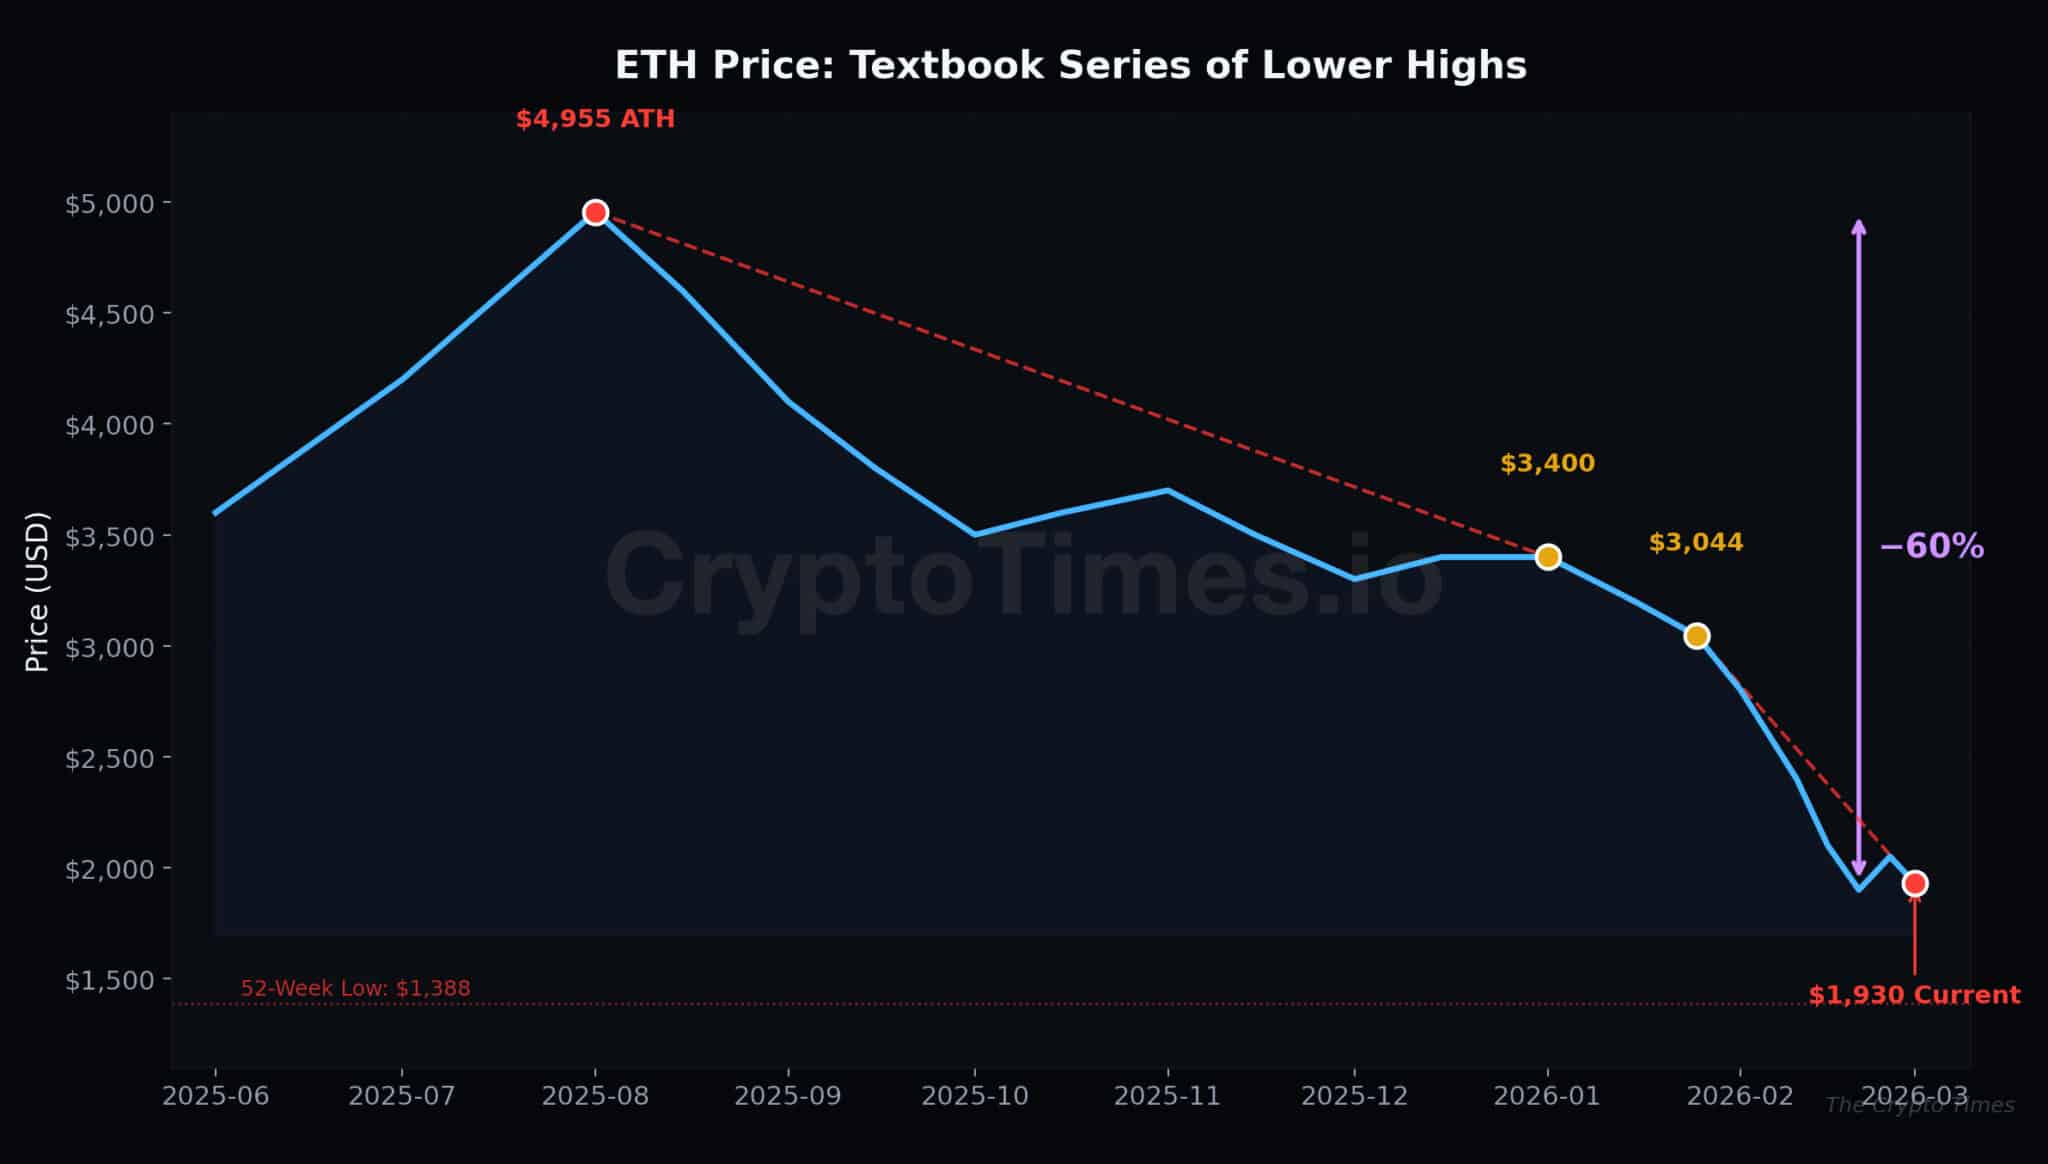
If you’ve been holding Ethereum through the past six months, you don’t need anyone to tell you it’s been brutal. ETH is trading around $1,930 — down roughly 60% from its all-time high near $4,955 set in August 2025. The 52-week range stretches from a gut-wrenching low of $1,388 to that summer peak, and right now, the asset sits uncomfortably close to the bottom of that range.
But here’s the thing about markets: the worst time to sell is often the moment it feels most necessary. And right now, several powerful signals suggest Ethereum may be approaching one of those inflection points where fear peaks just as the foundation for a recovery is being laid.
The Damage Report
Let’s not sugarcoat it. The technical picture is ugly by almost every traditional measure.
Ethereum has printed a textbook series of lower highs since the August peak: roughly $4,955, then $3,400 in January, then $3,044, and now the current level around $1,930. Price is trading 27% below its 50-day moving average and a staggering 45% below the 200-day. A “Death Cross” — the bearish signal where the 50-day average crosses below the 200-day — is confirmed and in effect. Every single moving average, from the 5-day to the 200-day, is flashing a sell signal.
In the past month alone, ETH has dropped more than 36%. Over six months, the decline is nearly 58%. Those aren’t corrections. Those are the kinds of numbers that make investors question everything they thought they knew about an asset.
The worst time to sell is often the moment it feels most necessary. And right now, several signals suggest Ethereum may be approaching an inflection point.
But Look a Little Closer
Here’s where the story gets more interesting.
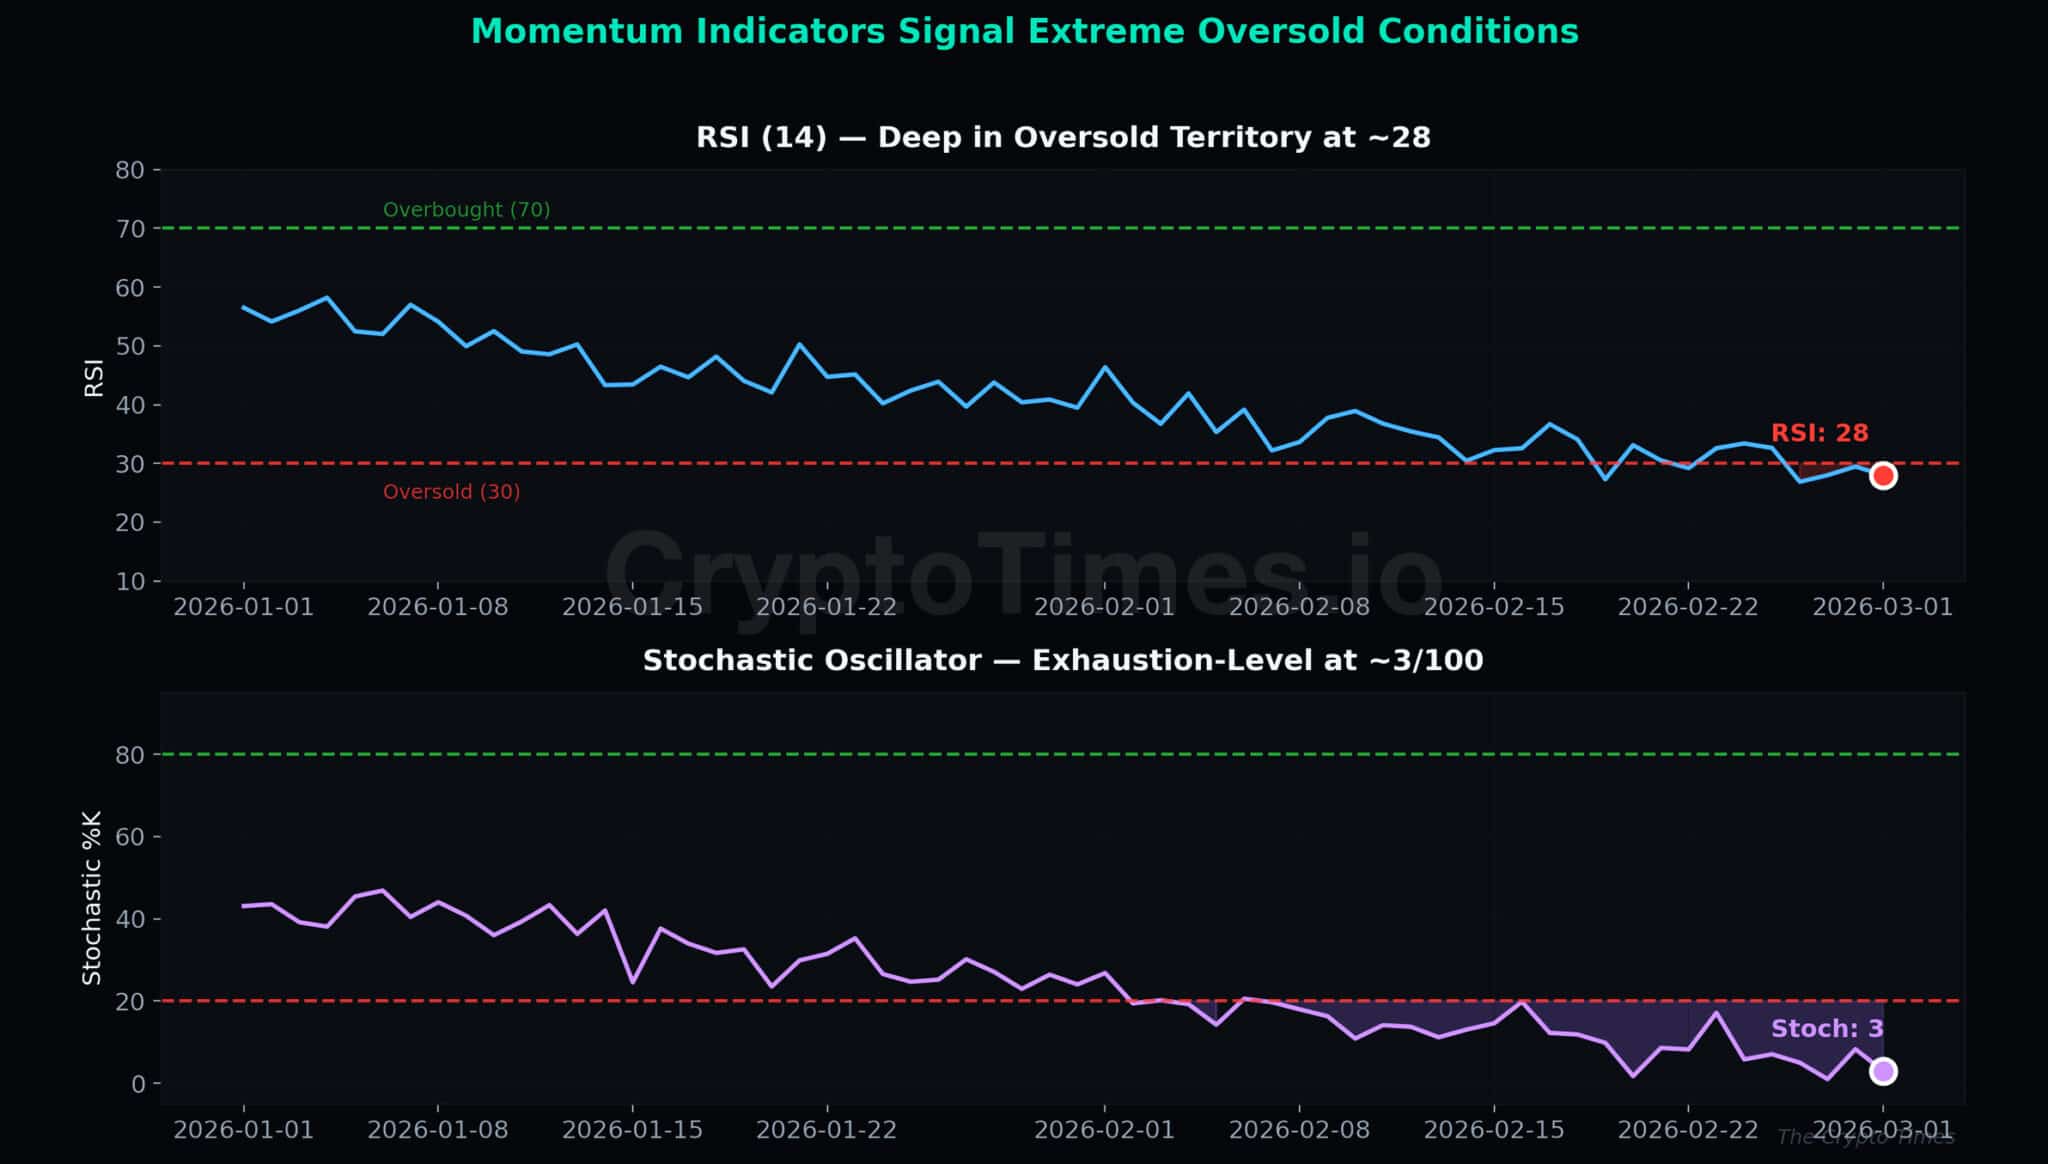
While the trend indicators are screaming caution, the momentum readings are telling a very different story. The Relative Strength Index (RSI) — a widely followed gauge of whether an asset is overbought or oversold — has plunged to around 28, deep in oversold territory. Any reading below 30 is considered extreme. The Stochastic oscillator, another momentum tool, is printing readings near 3 out of 100. That’s not just oversold. That’s exhaustion-level selling.
This creates what traders call a divergence: the longer-term trend says “bearish,” but the short-term momentum says “this selling has gone too far, too fast.” Historically, that combination has been the classic setup for a countertrend rally — a sharp bounce within a broader downtrend.
The derivatives market is sending similar signals. Open interest in ETH perpetual futures has dropped nearly 7% in just 24 hours and sits at a six-month low of around $10 billion. In plain English: the speculative excess has been wrung out. Leveraged traders who were betting on further declines (or holding onto losing longs) have largely been flushed from the market. That de-leveraging typically reduces the kind of forced selling that drives cascading liquidations.
Follow The Whales
Perhaps the most telling signal isn’t on any chart. It’s on the blockchain itself.
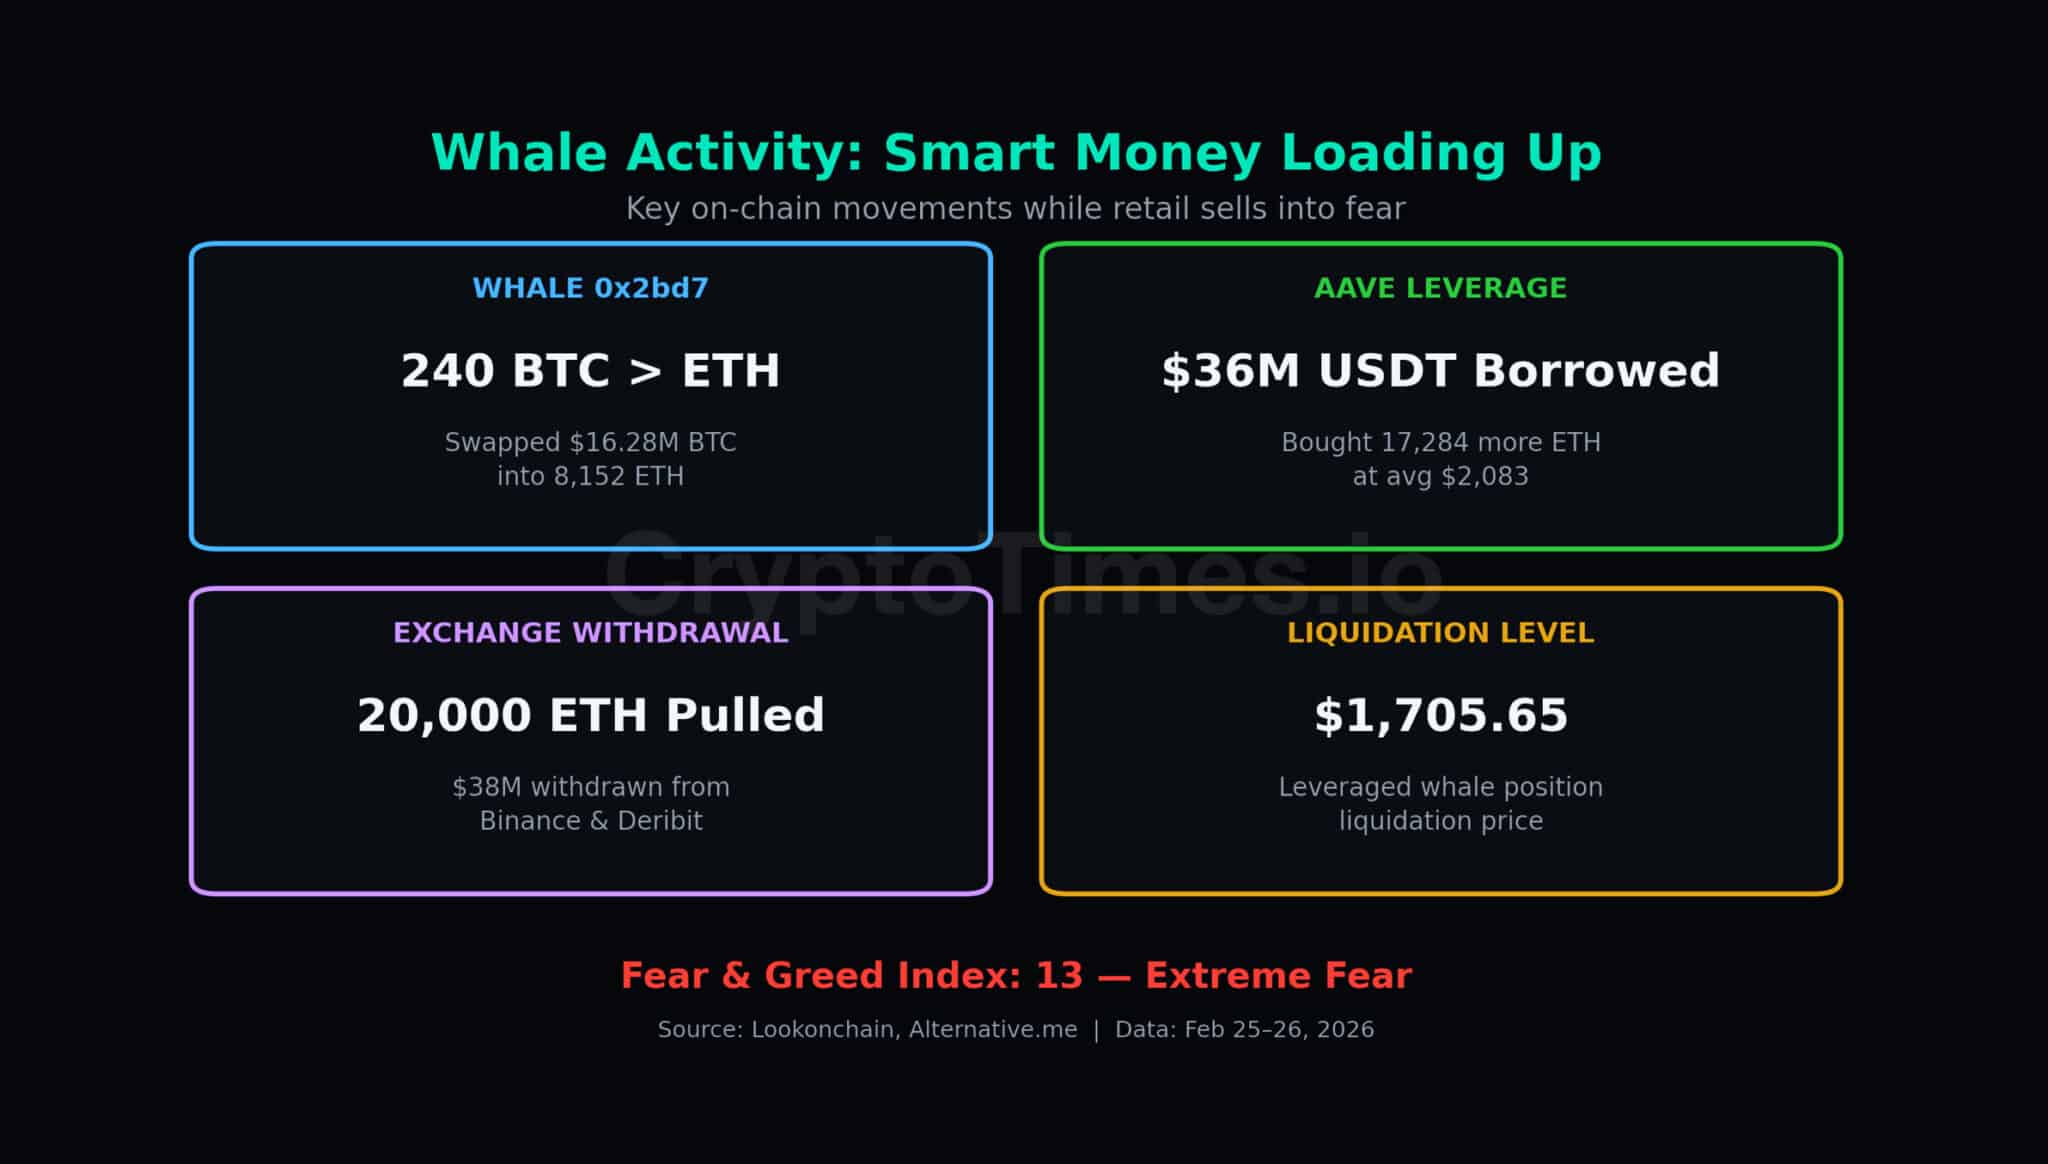
While retail investors have been hitting the sell button, large holders — the so-called whales — have been accumulating aggressively. One high-profile wallet recently converted 240 Bitcoin (worth over $16 million) into Ethereum, then borrowed $36 million through the Aave lending protocol to purchase an additional 17,000+ ETH at an average price near $2,083. That’s a massive, leveraged bet that ETH is undervalued at current levels.
Separately, another whale withdrew 20,000 ETH — roughly $38 million worth — from centralized exchanges. When large holders move assets off exchanges, it generally means they’re not planning to sell anytime soon. It reduces the available supply on the open market and eases near-term selling pressure.
The Crypto Fear & Greed Index, meanwhile, sits at 13 — firmly in “Extreme Fear” territory. Contrarian investors have long used this as a signal: when the crowd is most afraid, the best opportunities tend to emerge.
When retail is selling and whales are buying with leverage, the divergence tells a story the price alone doesn’t.
The Levels That Matter
For anyone watching this market, there are a handful of price levels that will determine what happens next.
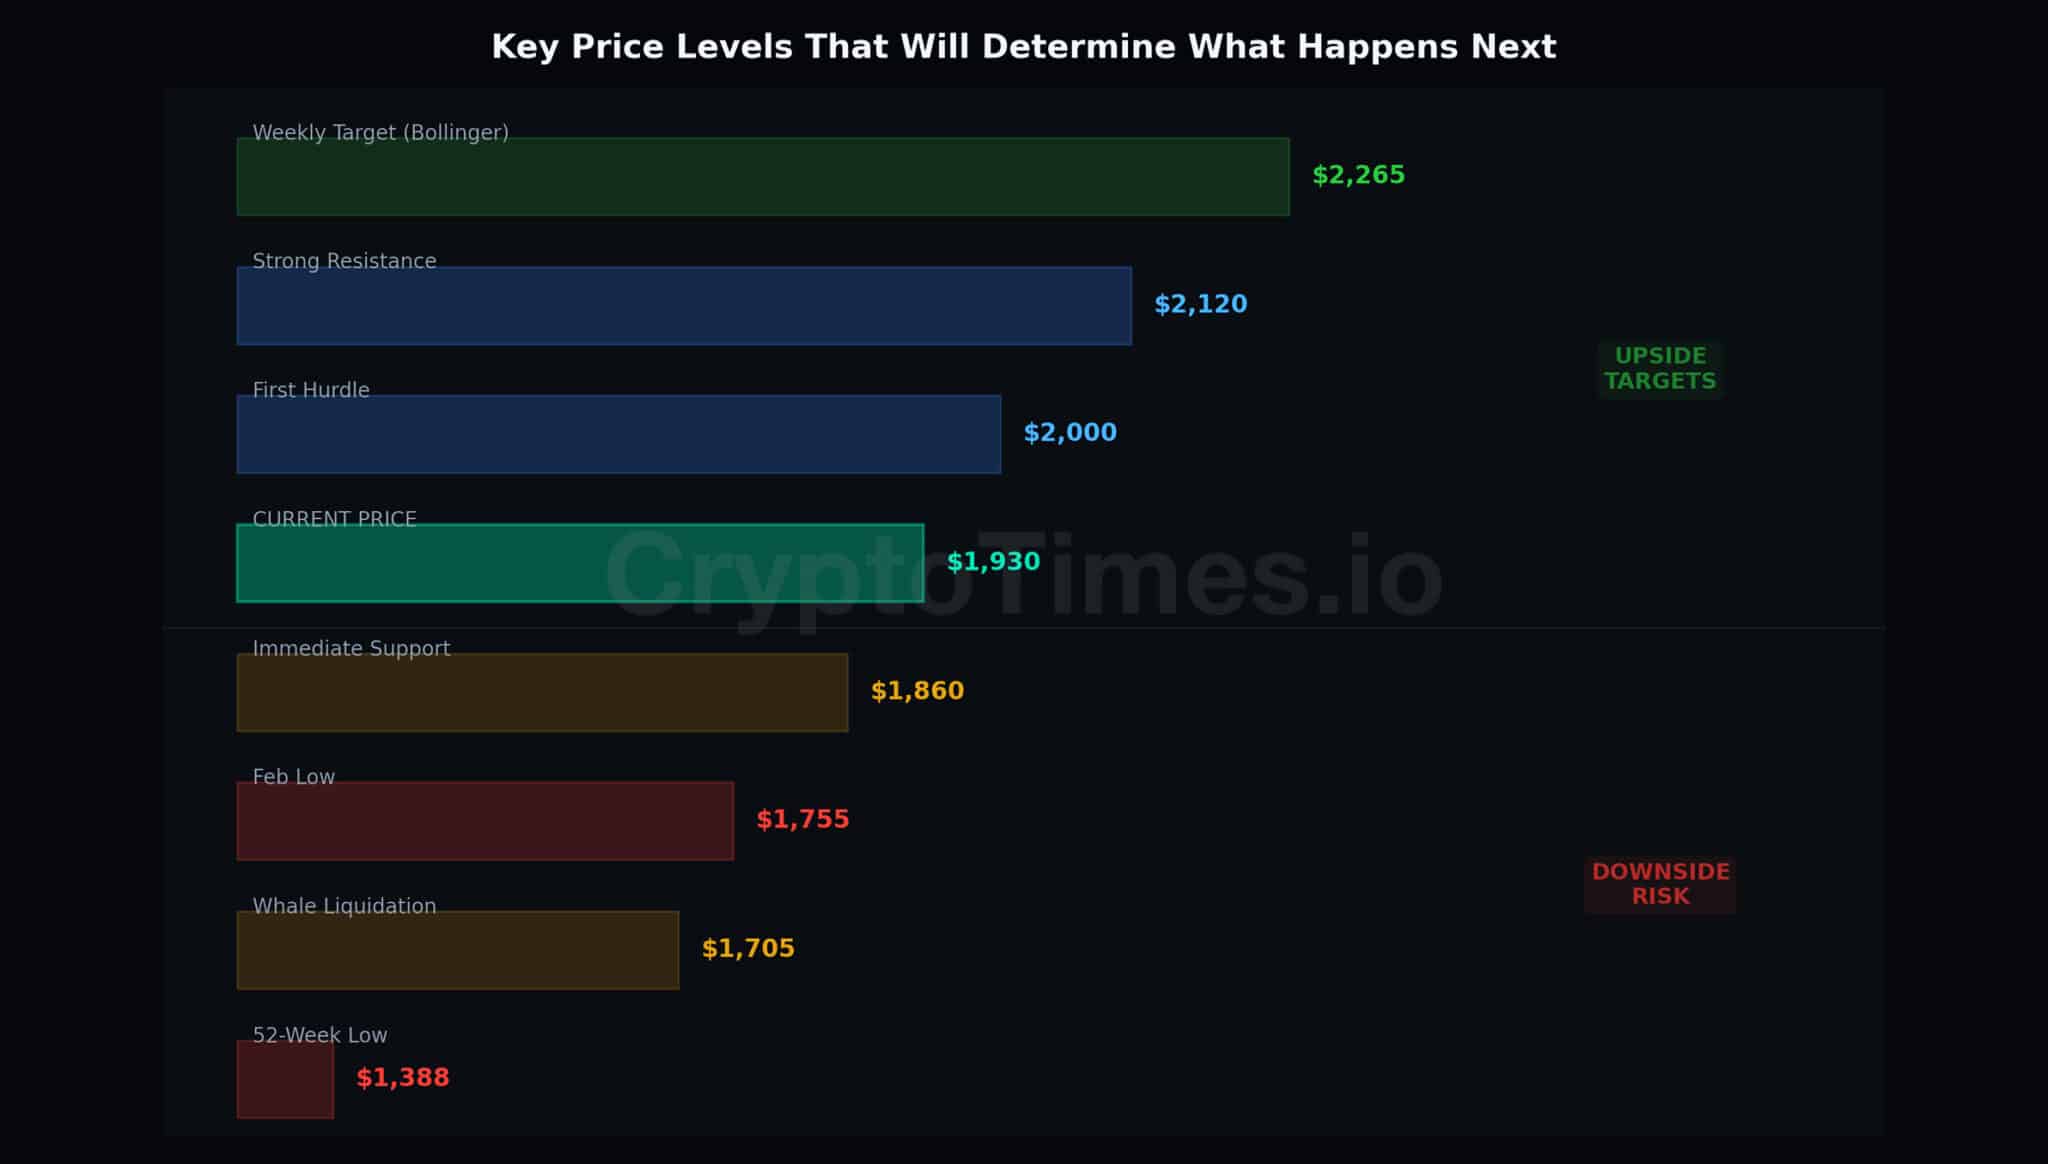
On the upside, the first hurdle is the $1,990–$2,010 zone. ETH needs to reclaim this area — and hold it — for any bullish case to activate. Beyond that, $2,100–$2,140 represents a strong resistance zone where multiple technical levels converge. A clean breakout above $2,140 would signal a genuine short-term trend change. The more ambitious target is $2,260–$2,270, which aligns with the upper Bollinger Band and marks a realistic weekly upside target.
On the downside, immediate support sits at $1,850–$1,870, the recent weekly low. Below that, the February low near $1,755 is the critical line in the sand. There’s also a specific reason to watch the $1,705 level: it’s reportedly the liquidation price for that large leveraged whale position mentioned earlier. If ETH drops to that level, forced liquidations could cascade and accelerate the decline. The worst-case scenario targets the 52-week low at $1,388.
What Happens Next
Let’s be honest about the range of outcomes.
The most likely near-term scenario (and we’d put it at roughly 50/50) is a relief rally toward $2,100–$2,200 over the next two to four weeks. The deeply oversold momentum readings, whale accumulation, and de-leveraging events all favor a technical bounce. The trigger to watch: a sustained close above $2,010 with rising volume.
The second possibility (around 30%) is continued sideways chop between $1,850 and $2,050 as the market absorbs selling pressure and builds a base. Boring, but constructive. This would be characterized by shrinking volume and narrowing price ranges — the market catching its breath before deciding on a direction.
The bearish case (around 20%) is a breakdown below $1,750 that opens the door to $1,600 or lower. This would likely require a broader macro catalyst — Bitcoin breaking key support, regulatory shock, or an acceleration in ETH ETF outflows. Speaking of which: U.S. spot ETH ETF holdings have declined from over 6.1 million ETH in late January to about 5.8 million by mid-February, with total assets falling from $18.6 billion to roughly $11.9 billion. That trend bears watching.
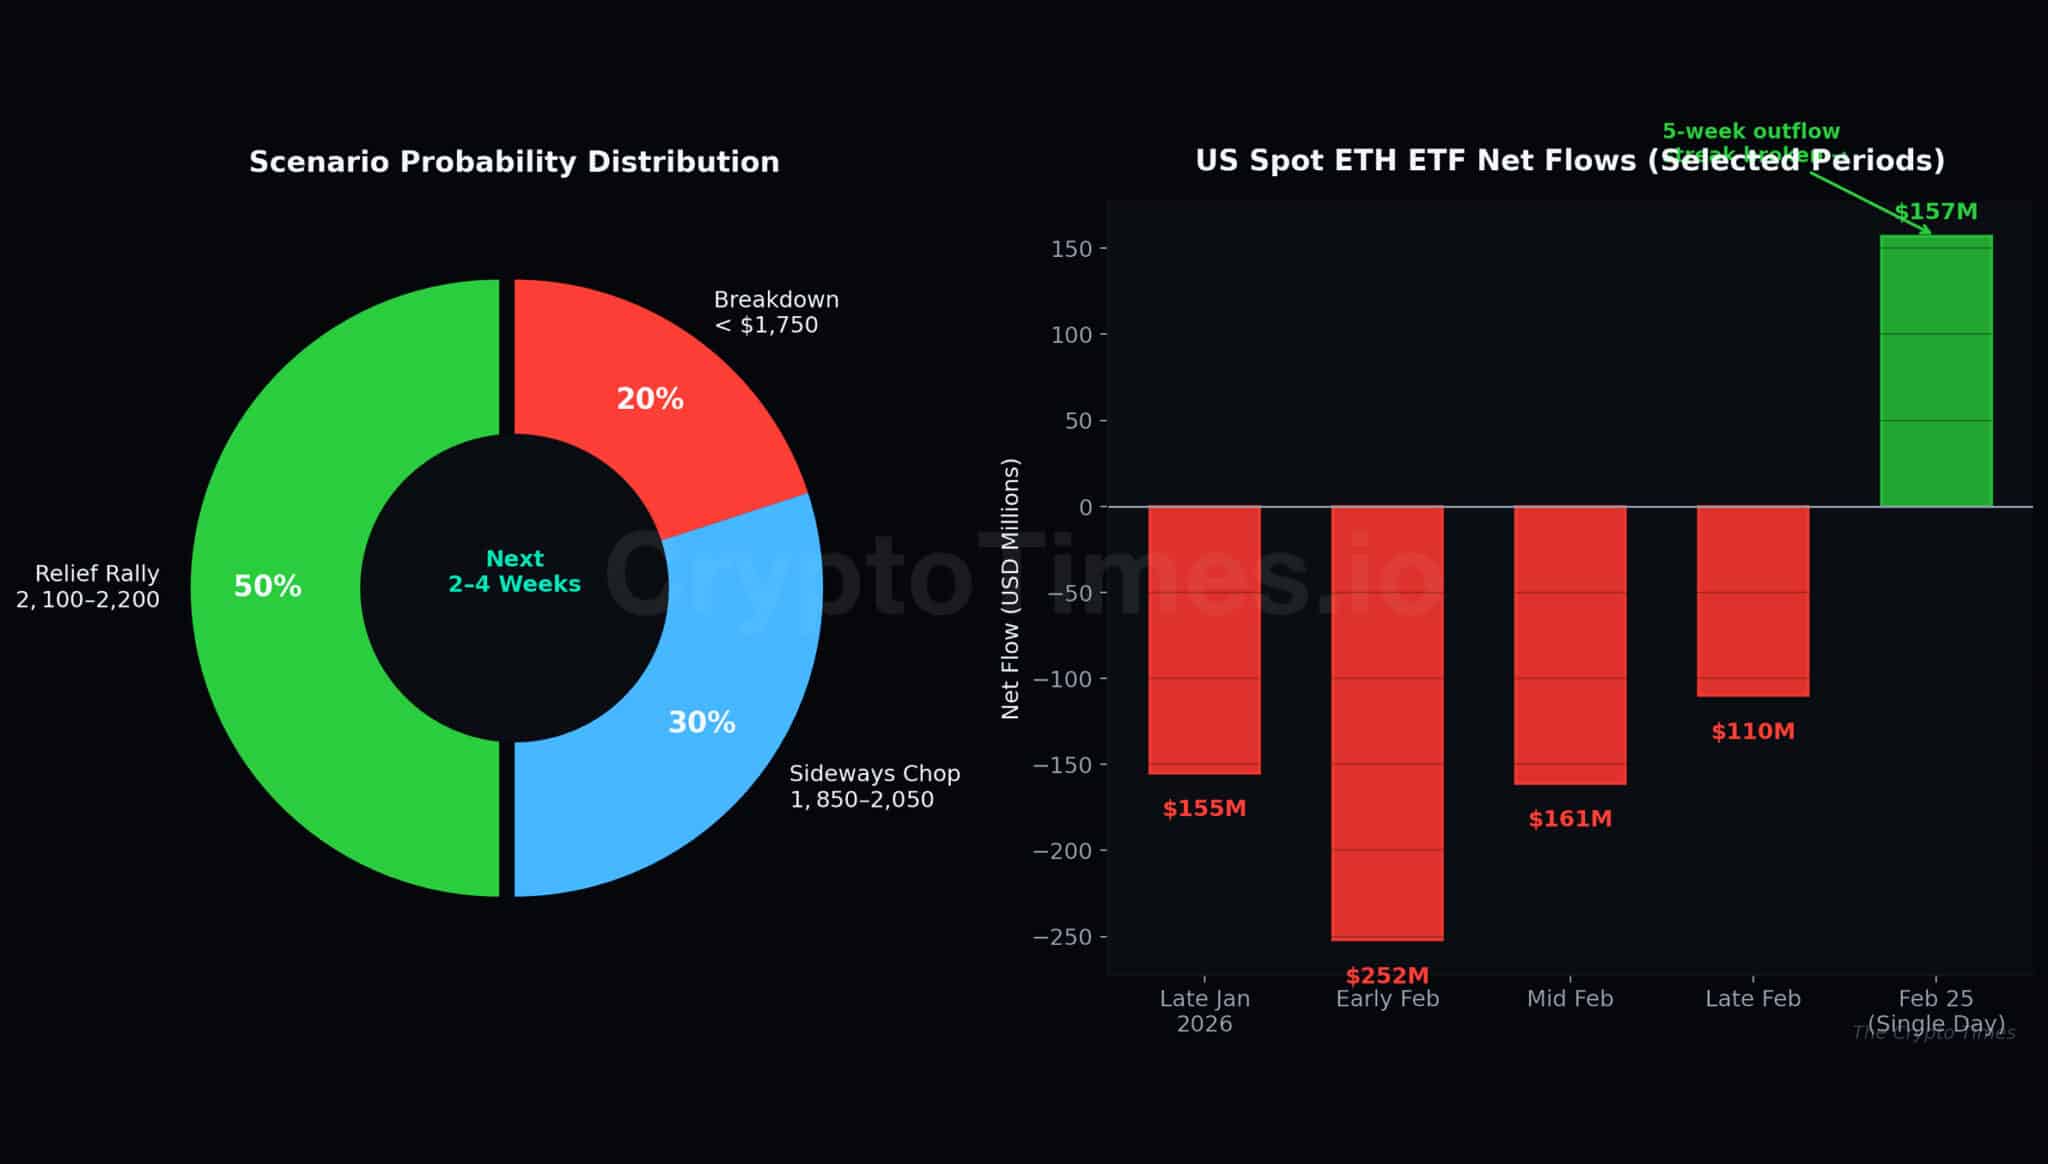
On the positive side of the institutional ledger, ETH spot ETFs recorded $157 million in net inflows on February 25 — the largest daily total since mid-January — snapping a five-week streak of outflows. If that institutional re-entry continues, it provides meaningful fuel for the recovery scenario.
The Bigger Picture
Looking further out — one to three months — the story becomes more nuanced. On-chain valuation metrics like the MVRV ratio suggest ETH could be near a potential cycle bottom, and historical patterns indicate that similar levels have preceded recovery phases. The Ethereum Foundation’s 2026 roadmap includes significant upgrades focused on scalability and user experience. Institutional infrastructure continues to build out, with major financial firms expanding their crypto capabilities.
None of that guarantees a rally. But it does suggest that the fundamental floor under Ethereum remains intact, even as the technical picture looks dire. The current price may be reflecting maximum pessimism about an asset whose long-term trajectory hasn’t fundamentally changed.
The current price may be reflecting maximum pessimism about an asset whose long-term trajectory hasn’t fundamentally changed.
What This Means For You
If you’re holding ETH with an entry above $3,000, you’re down 35% or more. The instinct to cut losses is understandable, but selling into deeply oversold conditions near a potential capitulation point is historically the worst time to exit. The more disciplined approach: set a hard stop-loss at $1,700 (below the whale liquidation level) and give the bounce thesis two to four weeks to develop. If your stop triggers, accept it — the structure would be broken beyond repair. But don’t let fear make that decision for you prematurely.
If you entered in the $1,800–$2,100 range, you’re actually sitting in what looks like a reasonable position given current conditions. A stop-loss around $1,740–$1,750 gives you defined risk, with a first target at $2,200 and an extended target at $2,500.
In either case, position sizing matters enormously in this environment. Daily price swings of 5% or more are routine right now. If the size of your ETH position is keeping you up at night, it’s too large — regardless of what the charts say.
Ethereum is at a genuine crossroads. The technical damage is real and severe. But the weight of evidence — from exhausted selling metrics to whale accumulation to extreme fear readings — suggests this is closer to a local bottom than the beginning of another leg down. Markets have a way of recovering just when it feels impossible. The question isn’t whether to be fearful. It’s whether you have the discipline to be strategic about it.
Also Read: Democrats Vs. Trump: Stablecoin Regulation or Backend Deal for WLFI?