For any serious trader, especially those executing high-frequency or large-volume strategies, advertised trading fees are just the tip of the iceberg. The real, often invisible, costs of trading are hidden within the market’s structure itself. When placing a contract order for $500,000 or more, the final execution price can vary by tens or even hundreds of dollars from one exchange to another. Over time, this difference, known as the hidden price cost, steadily erodes profits.
These costs are not arbitrary; they are a direct function of a platform’s liquidity. An exchange with deep liquidity can absorb large orders with minimal price impact, while a less liquid market will force traders to accept worse prices, a phenomenon known as slippage.
To quantify these critical differences, we conducted a comprehensive, data-driven comparison of the three core pillars of liquidity, the bid-ask spread, market depth, and slippage, across six of the world’s leading cryptocurrency derivatives platforms: Binance, Bybit, OKX, Bitget, Gate.io, and MEXC. Our objective analysis reveals substantial variations in real trading costs that every discerning trader should consider.
The Three Pillars of True Liquidity
Before diving into the data, it’s essential to understand the metrics that define the quality of a trading market. These three indicators, when viewed together, paint a complete picture of an exchange’s “true liquidity.”

1. Spread: The Entry Threshold
The bid-ask spread is the gap between the highest price a buyer is willing to pay for an asset (the bid) and the lowest price a seller is willing to accept (the ask). For anyone placing a market order, this spread represents an immediate and unavoidable cost of entry. A narrower spread indicates higher liquidity and a lower initial cost to execute a trade.
2. Depth: The Market’s Capacity
Market depth refers to the total volume of buy and sell orders waiting on the order book at various price points. An exchange with “deep” liquidity has a substantial number of orders clustered near the current market price. This depth acts as a cushion, allowing the market to absorb large orders without causing a significant price fluctuation. It is the ultimate measure of the market’s capacity to handle volume.
3. Slippage: The Realized Friction Cost
Slippage is the difference between the price you expect when you click “buy” or “sell” and the actual average price at which your order is filled. While slippage can occasionally be positive, it is most often a negative cost, especially for large market orders. It is the real-world validation of a market’s depth, low slippage proves that the displayed market depth is real and accessible.
| Indicator | Definition | Layer | What It Indicates | Impact on Trading Costs |
| Spread | Gap between best bid and best ask prices | First Layer (Most Visible) | Entry Threshold: The basic cost of a trade. | Tighter spreads lead to lower and more predictable execution costs. |
| Depth | Total order volume available within specific price ranges | Second Layer (Structural) | Market Capacity: The ability to handle volume without significant price impact. | Higher depth means large orders can execute with minimal price impact. |
| Slippage | Difference between expected and actual fill price | Third Layer (Real-world Validation) | True Execution Cost: The actual trading outcome. | Minimal slippage ensures lower hidden transaction costs. |
A market that excels in only one of these areas does not have “true liquidity.” For example, high depth with high slippage may suggest that the orders on the books are not genuine. Low slippage with low depth means the platform is only suitable for small retail trades. A truly liquid market is one that combines tight spreads, substantial depth, and minimal slippage.
Our Methodology: A Snapshot of the Market
To ensure a fair and objective comparison, out of a long list of centralized and decentralized crypto exchanges, we analyzed data across the six specified CEX, for the two most liquid contract pairs: BTCUSDT and ETHUSDT. The data focuses on the three pillars of liquidity.
- Spreads were measured to find the median and 95th percentile values, indicating both the typical and the more extreme spread costs.
- Market Depth was measured by aggregating the total value of resting buy and sell orders within price bands of ±0.01%, ±0.05%, ±0.1%, and ±0.2% from the mid-price.
- Slippage was measured for three different market order sizes: $100,000, $500,000, and $3,000,000.
It is important to note that liquidity is dynamic and can fluctuate based on market conditions, time of day, and specific events. This analysis represents a snapshot taken during a period of normal market activity on September 4, 2025, designed to provide a standardized baseline for comparison.
The Data Deep Dive: Comparing the Exchanges
Our analysis of the data revealed clear tiers of performance among the six platforms.
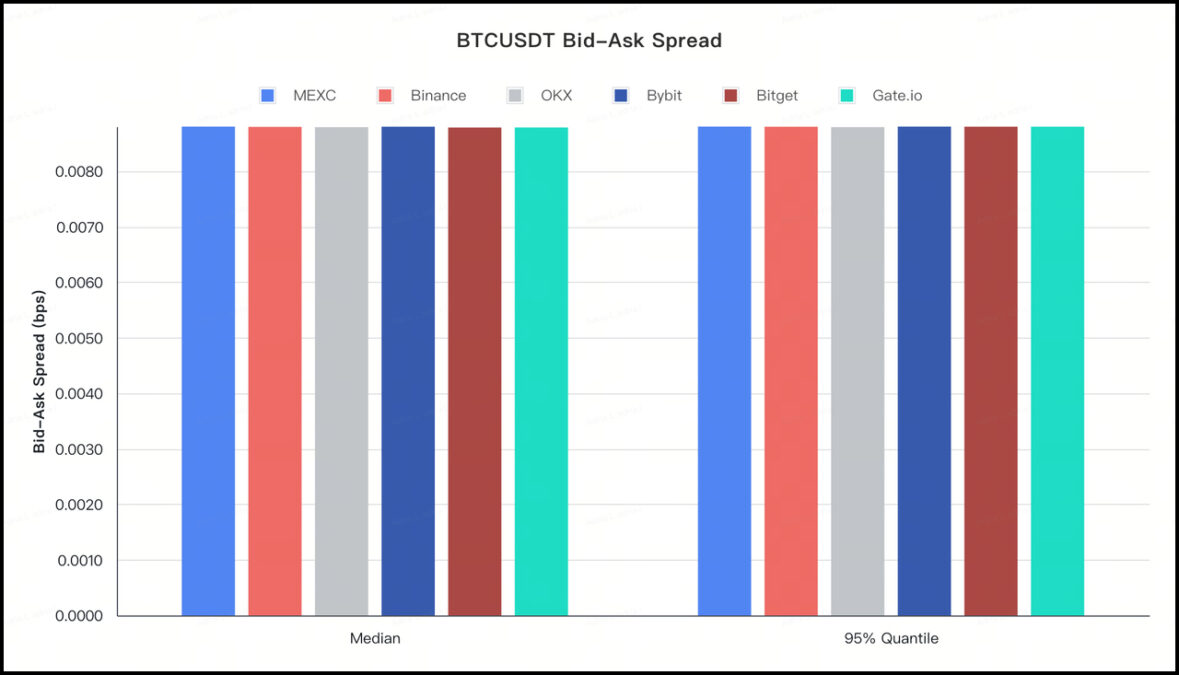
Spread Analysis: The Cost of Entry
For the BTCUSDT pair, liquidity was extremely high across the board. The median and 95th percentile spreads on all six exchanges were found to be around 0.008 bps. This indicates that for a $1,000,000 order, the round-trip cost (buying and then selling) from the spread alone is less than $1. Under normal conditions, the entry cost for BTC is near optimal on all tested platforms.
For ETHUSDT, the differences began to emerge.
- Binance, Bybit, OKX, Bitget, and MEXC all showed median spreads of approximately 0.02 bps. For a $1,000,000 order, this implies a round-trip cost of about $2.
- Gate.io was an outlier, with a spread of around 0.11 bps. This translates to a round-trip cost of about $11 for the same $1M order, over five times higher than its competitors.
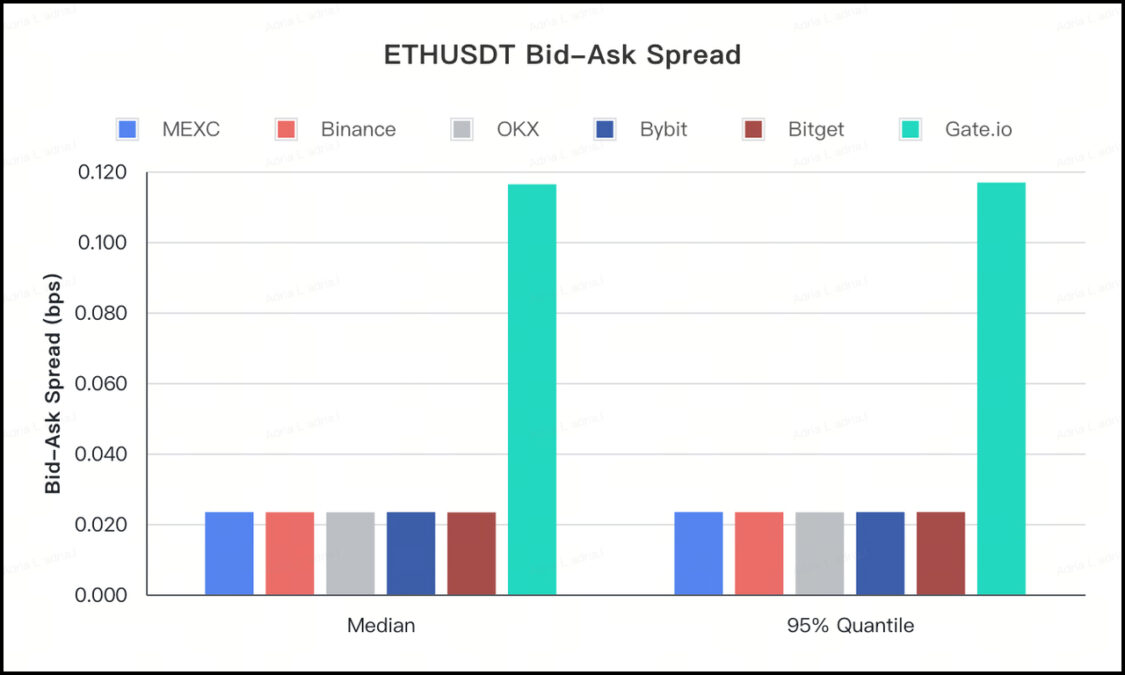
Conclusion: For basic entry costs on major pairs, most top exchanges offer extremely competitive spreads, with Gate.io showing a noticeably wider spread on ETHUSDT in our snapshot.
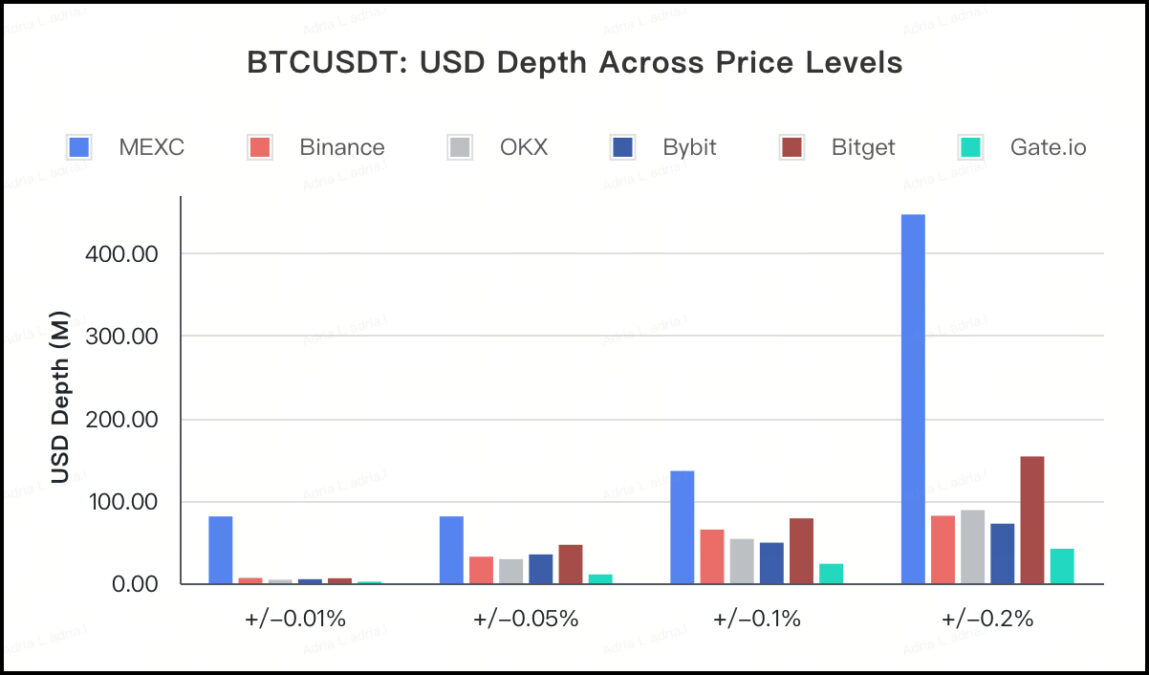
Market Depth Analysis: The Capacity to Handle Size
This is where the most significant differences were observed.
On BTCUSDT, within the narrowest price bands (±0.01% and ±0.05%), the data showed that MEXC aggregated approximately $80 million in orders. The other five platforms in the same bands held around $10 million and $50 million, respectively. As the price band expanded to ±0.2%, MEXC’s cumulative depth grew to roughly $450 million, maintaining a clear lead in the data provided.
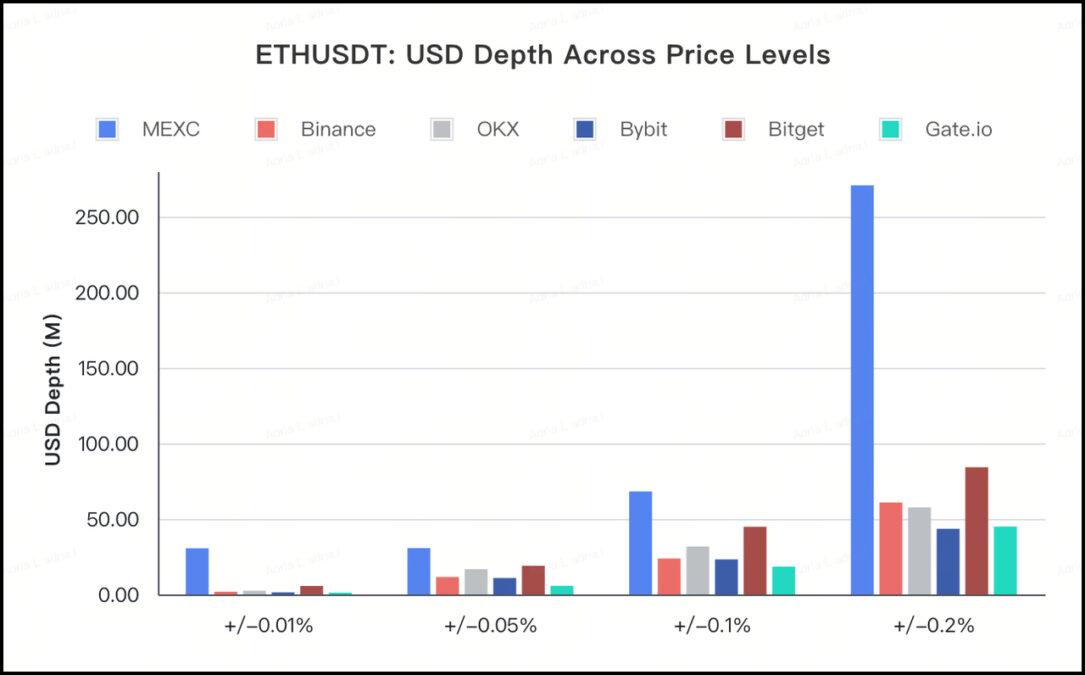
The ETHUSDT pair showed a similar structure. Within the ±0.05% band, MEXC’s depth was around $30 million, whereas the other exchanges ranged between $15 million and $18 million. At the ±0.2% band, this gap widened further, with MEXC at approximately $270 million versus a range of $40 million to $85 million for the others.
To illustrate, consider opening a 700 BTC position when the price is $100,000. On a platform with deeper liquidity like the one shown in the data for MEXC, this entire order could potentially be filled within a +0.10% price deviation, with an average price of around $100,040. On a platform with less depth, the same order would have to sweep further into the order book, potentially resulting in an average price closer to $100,130, an additional hidden cost of $63,000 on a single trade.
Slippage Analysis: The Real-World Result
Slippage data validates the market depth findings.
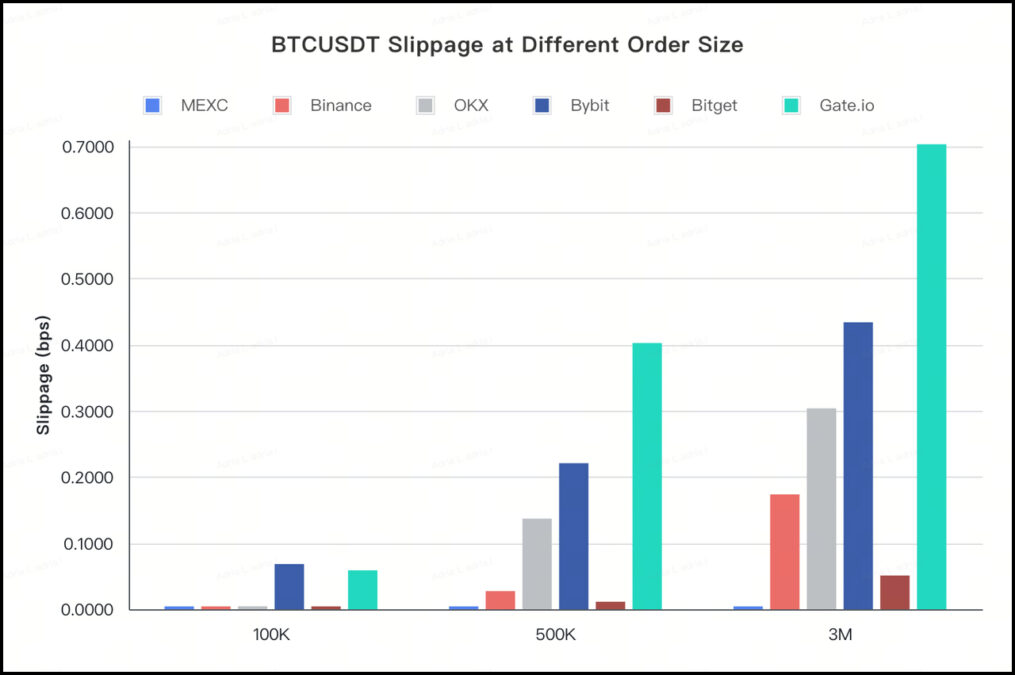
For BTCUSDT, the analysis showed that MEXC maintained near-zero slippage across all three order sizes ($100k, $500k, and $3M). While other exchanges were competitive at the $100k level, their slippage costs reportedly increased as the order size grew, indicating that larger orders had a more significant price impact.
For ETHUSDT, the differences were stark. The data provided for a $1,000,000 market order showed the following estimated costs from slippage:
- MEXC: ~0.025 bps (a cost of $2.50)
- Binance: ~0.84 bps (a cost of $84.00)
- Gate.io: ~1.51 bps (a cost of $151.00)
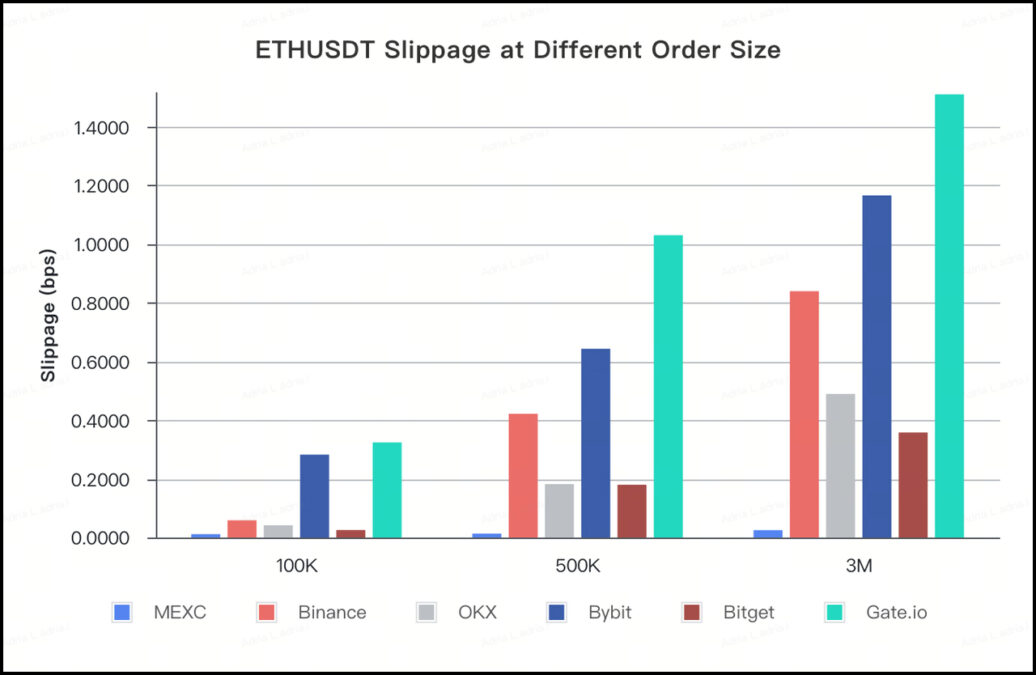
The cost deviation on Gate.io was over 60 times that of MEXC for the same order size. For large traders, institutions, or high-frequency strategies, this difference compounds rapidly and can be the difference between profit and loss.
Also Read: How Cryptocurrency Exchanges Really Make Money: A Deep Dive
What the Data Means in Practical Scenarios
1. Static Market Scenario: Seamless Daily Trading
In stable market conditions, deep liquidity ensures that standard limit and market orders can be executed instantly at the expected price. The data suggests that platforms with higher aggregate depth (as was seen with MEXC holding nearly $140 million within the ±0.1% BTC/USDT band) can execute trades from several thousand up to a million dollars with almost negligible implicit costs beyond the stated fees.
2. Volatile Market Scenario: Stability Under Pressure
The ultimate test of liquidity is during sharp market fluctuations. In these moments, less liquid platforms often experience “order book evaporation,” where liquidity vanishes, leading to massive spreads and catastrophic slippage. The data indicates that platforms with a deep “buffer zone” of orders are better equipped to handle volatility. When a platform can absorb a $3 million market order with less than 0.1 bps of slippage, it demonstrates a robustness that ensures traders can enter and exit positions even when the market is moving violently.
Conclusion: The Importance of True Liquidity
While trading fees are easy to compare, they are a misleading indicator of the true cost of trading. Our objective analysis of spreads, depth, and slippage across six leading exchanges reveals that the underlying liquidity structure is a far more significant factor, especially for traders operating at scale.
The data in our snapshot indicated that while most platforms are competitive on spreads for major pairs, there are substantial and measurable differences in market depth and real-world slippage. The analysis showed one platform, MEXC, with a significant lead across all three metrics for the pairs tested. Other giants like Binance and Bybit remain top contenders, while some platforms show weaknesses, particularly in handling large order sizes.
For traders, the takeaway is clear: look deeper than the fees. The quality of a platform’s market, defined by its ability to offer tight spreads, absorb large orders, and deliver on expected prices, should be a primary consideration. Before committing significant capital, savvy traders should not only compare fee schedules but also take a critical look at the order book. After all, the best fee schedule in the world is meaningless if hidden costs are eating away at your returns.
Disclaimer: Some elements of this content may have been enhanced with the help of our artificial intelligence (AI) assistants for purposes such as basic refinement, review, image generation, and translation to deliver high-quality news in a shorter time frame. However, all AI-assisted content is reviewed and approved by our team to ensure accuracy, fairness, and editorial integrity.