
Ethereum (ETH), the second-largest cryptocurrency by market capitalization, recovered toward $2,445 on Friday, October 16, 2026, as traders betting on further declines were forced out of their positions. The rebound came a day after hotter-than-expected U.S. producer inflation data dragged the token to its lowest level of the past 24 hours and added to concerns over further Federal Reserve rate hikes.
Ethereum Price Today: ETH Trades Near Its 24-Hour High
ETH traded at $2,444.75, up 4.2% over 24 hours, according to CoinGecko data. The token moved between a low of $2,324.97 and a high of $2,463.31 during that period, leaving it about 5.2% above the low and less than 1% below the high.
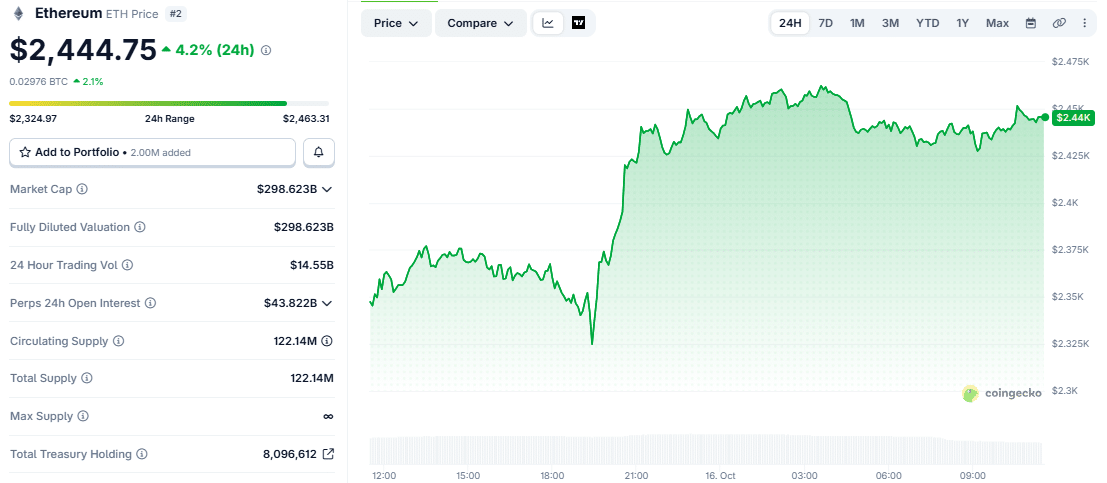
Against Bitcoin (BTC), ETH traded at 0.02976 BTC, up 2.1%, showing that Ether outperformed the largest cryptocurrency during the recovery. Ethereum’s market capitalization stood at $298.62 billion, with 24-hour trading volume of $14.55 billion and a circulating supply of 122.14 million ETH.
CoinGecko’s Ethereum treasury tracker reported that public companies held a combined 8,096,612 ETH, equivalent to approximately 6.6% of Ethereum’s total supply. The figure reflects the holdings listed by the tracker and should not be interpreted as a measure of all institutional ETH holdings.
The intraday chart shows a two-stage move. ETH dropped sharply on Thursday evening in Indian Standard Time (IST), shortly after the U.S. inflation data was released, before reversing and climbing back above $2,400 within hours. The token then reached its 24-hour high during early Asian trading hours on Friday and has since held in the $2,425 to $2,460 area.
ETH Short Liquidations Reach $45.46 Million
A liquidation happens when an exchange forcibly closes a leveraged position because the trader’s collateral no longer covers potential losses. A short position is a bet that the price will fall, so a rising price can force short sellers out of the market.
CoinGlass liquidation data, updated at 6:20 a.m. UTC on October 16, showed $73.42 million in Ethereum positions liquidated over the rolling 24-hour window. Short liquidations made up $45.46 million, or 59.7%, while long liquidations totaled $30.74 million, or 40.3%. Long positions are bets that the price will rise; those losses came largely during Thursday’s drop, which still falls within the 24-hour window.
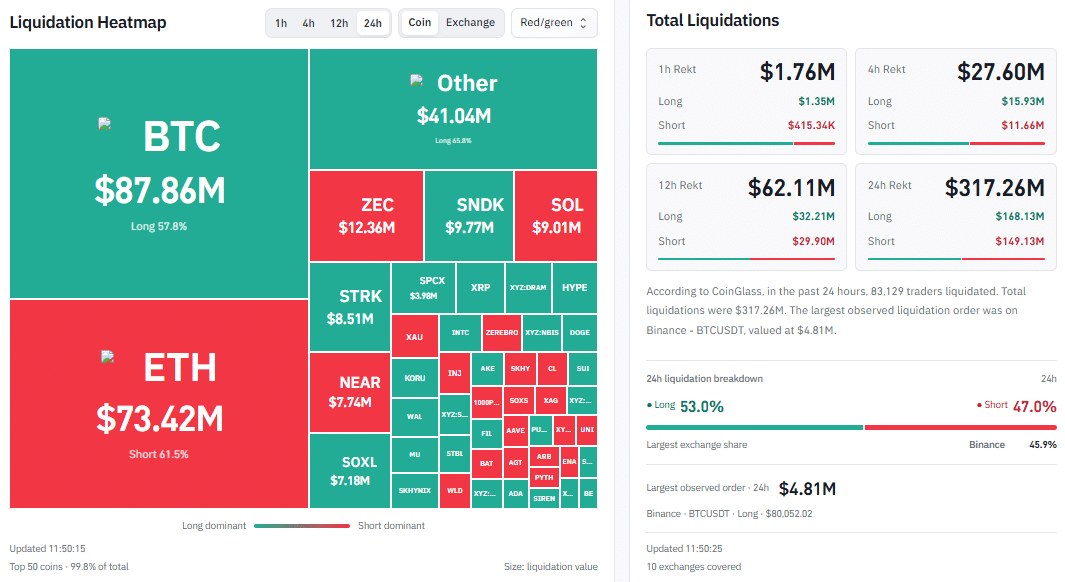
The composition marks a reversal from the previous session. On Thursday morning, Ethereum led all digital assets in liquidations with $288.60 million in total positions closed, 92.1% of them longs. Friday’s ETH total is roughly a quarter of that figure, indicating that forced selling has eased considerably.
Across the broader crypto market, CoinGlass recorded $320.89 million in liquidations affecting 84,257 traders over 24 hours. Longs accounted for $170.90 million, or 53.3%, and shorts for $149.99 million, or 46.7%. That is about one-third of the nearly $937 million in market-wide liquidations recorded on Thursday. Binance accounted for 46.1% of liquidation volume across the 10 exchanges tracked, and the largest single order was a $4.81 million Bitcoin long on Binance’s BTCUSDT pair, closed near $80,052.02.
Why Did Ethereum Fall Before Rebounding? Hot US Inflation Data
The drop that set up Friday’s rebound followed the U.S. Bureau of Labor Statistics (BLS) September Producer Price Index (PPI) report, released on Thursday, October 15, at 8:30 a.m. ET. The PPI measures changes in the prices domestic producers receive for their goods and services and is often watched as an early signal for consumer inflation.
Final-demand producer prices rose 1.3% in September, the largest monthly increase since March 2022, and 6.3% year over year, the steepest annual gain since December 2022. Economists polled by Dow Jones had expected a 0.6% monthly rise and a 5.5% annual increase. Energy drove much of the advance, with the final-demand energy index rising 10.8% and gasoline prices jumping 20.3%.
The PPI followed a hotter-than-expected Consumer Price Index (CPI) report on Wednesday, October 14. The CPI tracks the prices consumers pay for a basket of goods and services. Headline CPI rose 3.7% year over year, above the 3.6% consensus, while core CPI, which excludes food and energy, rose 2.6% against a forecast of 2.5%.
The back-to-back inflation releases coincided with selling across crypto markets and added to uncertainty about the Federal Reserve’s policy path.
Fed Rate Hike Risk Keeps Pressure on Crypto Markets
The inflation data matters because the Federal Reserve is already raising rates. On September 16, the Federal Open Market Committee (FOMC), the Fed’s rate-setting body, raised the federal funds target range by 25 basis points to 3.75% to 4.00%. The committee’s next policy meeting is scheduled for October 27 and 28.
Higher interest rates raise returns on cash and bonds, which tends to reduce demand for risk assets such as cryptocurrencies. The hotter CPI print had already revived October rate hike odds before the PPI data added to that pressure. Available market data does not establish whether short covering, spot buying, or other activity drove the subsequent recovery.
Spot Ethereum ETF Outflows Preceded the Inflation Data
Selling pressure had been building before the inflation releases. U.S. spot Ethereum exchange-traded funds (ETFs), which give investors exposure to ETH through regulated stock market products, recorded about $542 million in net outflows during the week of October 5 to October 9, according to data from SoSoValue. The funds lost a further $85.4 million on October 12.
Leverage Remains Elevated Despite the Flush
Open interest in ETH perpetual futures stood at $43.82 billion, little changed from about $43.97 billion on Thursday. Perpetual futures are derivative contracts with no expiry date that let traders take leveraged positions on an asset’s price, and open interest measures the total value of those contracts still outstanding.
The steady reading suggests that the liquidations of the past two days have not significantly reduced overall leverage in ETH markets. Exchange concentration also remains high, with Binance recently holding about 49% of ETH open interest, its highest share since 2023.
Ethereum Price Analysis: Key Levels to Watch
ETH is trading just below its 24-hour high of $2,463.31, which marks the first resistance level. A sustained move above the $2,450 to $2,465 zone would extend the recovery from Thursday’s low, while the $2,500 area, where ETH traded before the CPI release, sits above that.
On the downside, $2,400 is the nearest support level that ETH reclaimed during the rebound. A break below it would bring the $2,325 to $2,350 zone, which includes Thursday’s low of $2,324.97, back into focus. With open interest near $44 billion, another sharp move in either direction could trigger a fresh round of liquidations, and the FOMC decision later this month remains the next major macro event for crypto markets.
Also Read: Crypto Price Today: Bitcoin and Ethereum Recover Modestly After Inflation-Driven Dip