
Ethereum (ETH), the second-largest cryptocurrency by market capitalization, fell 6.2% over the past 24 hours to $2,351.63 on Thursday, October 15, 2026, as forced selling of leveraged bullish bets deepened a decline that began after hotter-than-expected U.S. inflation data. Ethereum led all digital assets in liquidations, with $265.67 million in long positions closed over the past day.
Ethereum Price Today: ETH Trades Near Its 24-Hour Low
ETH traded at $2,351.63, according to CoinGecko data at 05:50 UTC on October 15, after moving between a low of $2,332.43 and a high of $2,524.82 over 24 hours. That leaves the token about 6.9% below its session high and less than 1% above its low. Against Bitcoin, ETH traded at 0.02904 BTC, down 3.4%, showing it underperformed the largest cryptocurrency during the selloff.
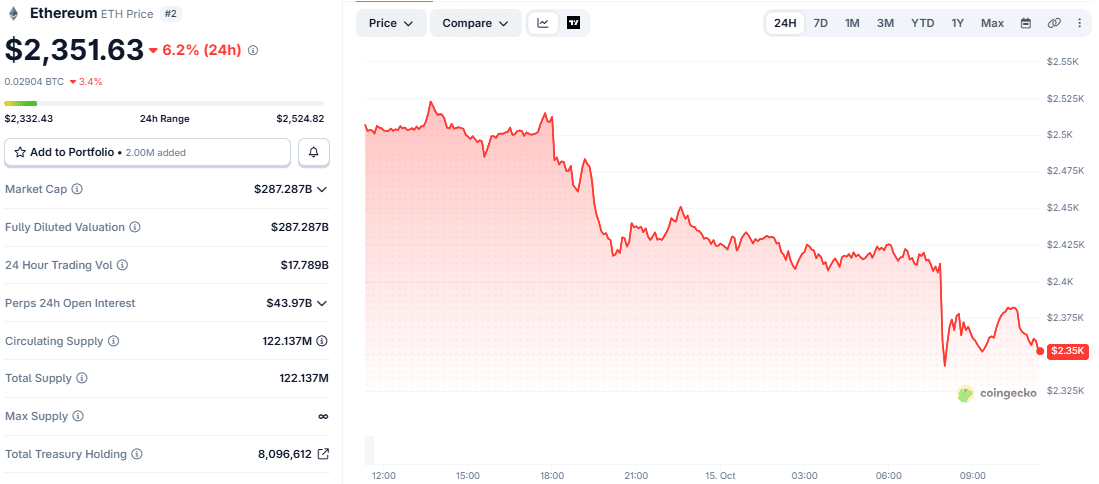
The intraday chart shows the decline came in two legs. The first began around 12:30 PM UTC on October 14, when the U.S. inflation data was released. The second, sharper drop came around 02:30 AM UTC on October 15, when ETH fell from about $2,410 to near its 24-hour low. A brief rebound toward $2,380 later faded.
Ethereum’s market capitalization stood at $287.287 billion, with 24-hour trading volume of $17.789 billion and a circulating supply of 122.137 million ETH. Corporate and institutional treasuries hold 8,096,612 ETH, about 6.6% of supply, per CoinGecko.
Open interest in perpetual futures was $43.97 billion. Perpetual futures are derivative contracts with no expiry date that let traders take leveraged positions on an asset’s price. Open interest measures the total value of those contracts still outstanding.
ETH Liquidations Reach $288.60M as Longs Take 92% of Losses
A liquidation happens when an exchange forcibly closes a leveraged position because the trader’s collateral no longer covers potential losses. A long position is a bet that the price will rise.
CoinGlass liquidation data, updated around 05:31 UTC on October 15, showed $288.60 million in Ethereum positions liquidated over the rolling 24-hour window. Long liquidations made up $265.67 million, or 92.1%, while short liquidations totaled $22.93 million, or 7.9%.
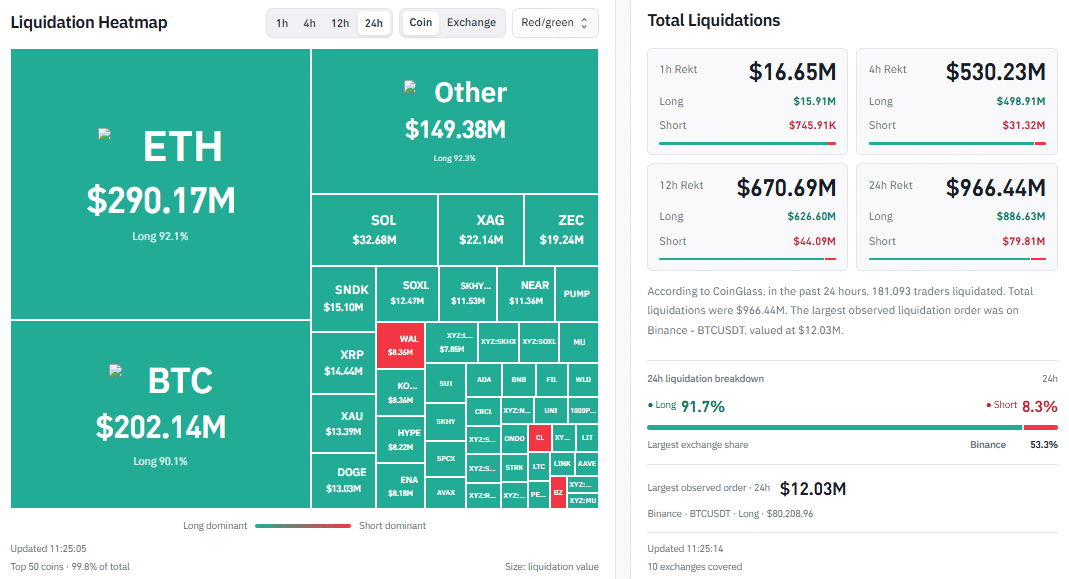
Bitcoin (BTC) recorded $198.90 million in liquidations over the same period, with longs accounting for 90.0%. Across the crypto market, liquidations reached $959.14 million and affected 179,532 traders, with long positions representing 91.7% of the total. Ethereum alone accounted for about 30% of the market-wide figure.
Binance, the largest exchange by share in the data, accounted for 53.4% of all liquidations. The largest single liquidation was a $12.03 million Bitcoin long on Binance’s BTCUSDT pair, closed near $80,208.96.
Why Is Ethereum Price Down? Hot US CPI Report Lifts Rate Hike Odds
The decline traces back to the U.S. Bureau of Labor Statistics (BLS) September Consumer Price Index (CPI) report, released on Wednesday, October 14, at 8:30 a.m. ET. The CPI tracks changes in prices that consumers pay for goods and services and is a key U.S. inflation gauge.
Headline CPI rose 3.7% year over year, up from 3.4% in August and above the 3.6% consensus. Prices rose 0.6% month over month, up from 0.4% in August. BLS data showed that a 9.1% jump in the gasoline index accounted for more than half of the monthly increase.
Core CPI, which excludes volatile food and energy prices, rose 2.6% annually. That was up from 2.4% and a tenth above the 2.5% that economists had forecast ahead of the release.
The print matters because the Federal Reserve is already tightening. On September 16, the Federal Open Market Committee (FOMC), the Fed’s rate-setting body, raised the federal funds target range by 25 basis points to 3.75% to 4.00%. The hotter inflation data strengthened expectations of another increase at the committee’s October 27 and 28 meeting. Higher rates increase returns on cash and bonds, which tends to reduce demand for risk assets such as cryptocurrencies.
In The Crypto Times’ live coverage of the CPI release, ETH traded at $2,499.37 at 7:31 a.m. EDT, about an hour before the data came out. Sygnum Bank said in the same coverage that the hotter core reading put an October rate hike back in play. By 17:33 UTC that day, Ethereum had dropped about 5% to $2,437. Thursday’s price of $2,351.63 sits roughly 5.9% below the pre-release level.
Spot Ethereum ETF Outflows Added Pressure Before CPI
Selling pressure had been building before the inflation data. U.S. spot Ethereum exchange-traded funds (ETFs) give investors exposure to ETH through regulated stock market products. They recorded about $542 million in net outflows during the week of October 5 to October 9, according to data from SoSoValue. BlackRock’s iShares Ethereum Trust (ETHA) accounted for about $477 million of that total.
The funds lost another $85.4 million on October 12. During the broader market selloff on October 8, ETH briefly slid toward $2,400 before recovering. It has now broken that level below.
How Liquidation Cascades Deepened the ETH Selloff
Liquidations do more than record losses. When an exchange closes a leveraged long position, it sells the asset at market price. That selling pushes prices lower, which can trigger the next layer of liquidations and stop-loss orders. Traders call this a liquidation cascade.
Ethereum’s liquidations exceeded Bitcoin’s by about $89.70 million, even though Bitcoin’s market value is several times larger. That gap suggests leveraged positioning in ETH derivatives was heavier relative to the size of its market, which left it more exposed when prices turned. ETH’s 3.4% drop against BTC fits that picture.
The pattern is not new this month. During a selloff on October 8 and 9, total crypto liquidations reached about $1.19 billion. Ethereum’s roughly $356 million again exceeded Bitcoin’s roughly $298 million, according to CoinGlass figures at the time.
Ethereum Price Analysis: Key Levels and Data to Watch
Traders are watching the $2,330 to $2,350 support zone, which includes Thursday’s 24-hour low of $2,332.43. ETH is now trading at the top edge of that zone. On the upside, the $2,380 area capped Thursday morning’s rebound. Beyond that, $2,400 is the next level ETH would need to reclaim, followed by the $2,500 area where it traded before the CPI release and the 24-hour high of $2,524.82.
The next macro test arrives later on Thursday. The BLS will publish the September Producer Price Index (PPI), which measures prices received by domestic producers. The U.S. Census Bureau will release advance retail sales data for September. Both reports are scheduled for 8:30 a.m. ET on October 15.
Derivatives data will also shape the next move. Funding rates are periodic payments between long and short traders that keep perpetual futures prices close to spot prices, and they show which side is paying to hold positions. If funding stays positive while open interest rises again, fresh leverage may be rebuilding. If both cool, the latest flush may have cleared much of the excess long exposure.