
Bitcoin and Ethereum, the two largest cryptocurrencies by market capitalization, showed modest recoveries in early trading on October 16, 2026, after a sharp midweek sell-off triggered by hotter-than-expected US inflation readings.
According to data from CoinGecko as of approximately 05:50 AM UTC on October 16, Bitcoin traded near $82,001.85, up 1.3% over the prior 24 hours, with a daily range of $79,805.99 to $82,508.10.
Ethereum stood at $2,444.77, higher by 3.5% in the same period, ranging from $2,324.97 to $2,463.31. The moves followed a session in which both assets tested lower support levels amid renewed questions about the path of US interest rates.
Market participants continue to weigh the interplay between macroeconomic data, leveraged positioning in derivatives markets, and longer-term structural demand from institutions and corporate treasuries. While the latest bounce has steadied prices above recent lows, both assets remain well below their respective all-time highs recorded in 2025.
Bitcoin Price Holds Near $82,000 After Testing Sub-$80,000 Levels
Bitcoin’s latest price action reflects a classic test of key psychological and technical support. The asset briefly fell below $80,000 on October 15 before buyers stepped in, as shown in the TradingView chart.
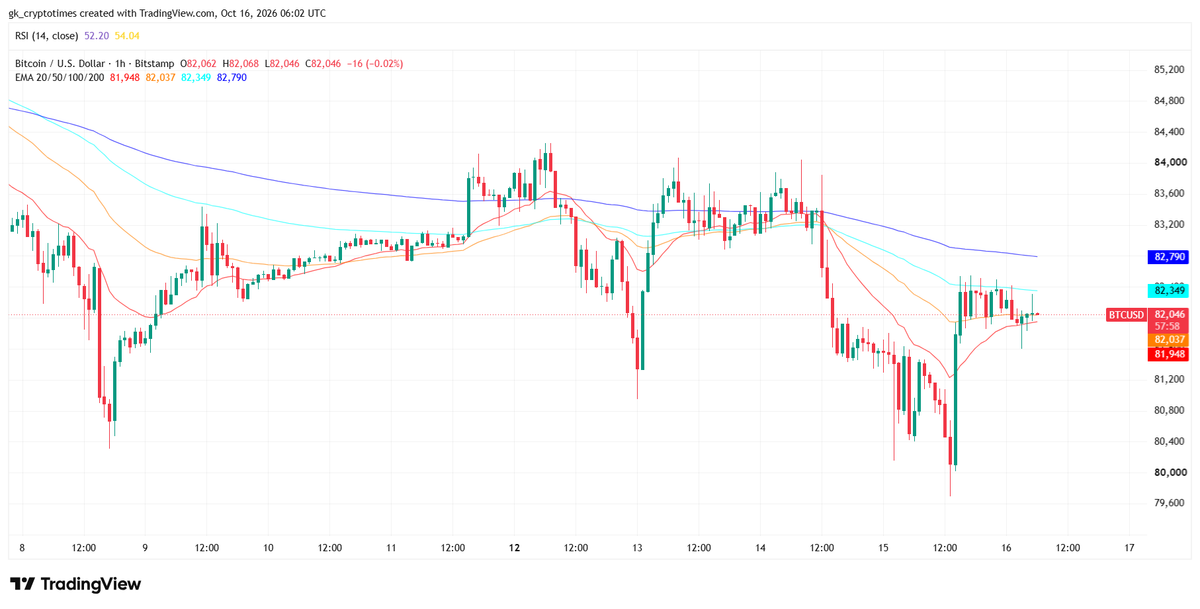
At the time of the latest CoinGecko snapshot, Bitcoin’s market capitalization stood at approximately $1.649 trillion, supported by a circulating supply of about 20.099 million coins and 24-hour trading volume near $33.537 billion. The cryptocurrency remains roughly 34.9% below its all-time high of $126,080, set on October 6, 2025.
The recovery has been orderly rather than explosive. Daily ranges over recent sessions have frequently spanned several thousand dollars, underscoring elevated short-term volatility even as the broader multi-month range has narrowed relative to earlier 2025 peaks. Observers note that Bitcoin’s dominance within the total cryptocurrency market has remained relatively stable, consistent with periods when risk appetite is tempered by macro uncertainty.
Trading activity has concentrated on major centralized exchanges, with volume profiles indicating that the sub-$80,000 dip attracted dip-buying interest from both discretionary traders and some automated strategies. Open interest in perpetual futures has moderated from earlier-week highs, reducing the immediate fuel for further cascading moves in either direction.
Ethereum Outperforms on the Bounce but Remains Far From Prior Peaks
Ethereum has displayed relatively stronger percentage gains over the latest 24-hour window, climbing 3.5% to $2,444.77 per CoinGecko data. Its market capitalization is approximately $298.59 billion, with 24-hour volume of roughly $14.814 billion and a circulating supply near 122.14 million ETH. The asset trades about 50.6% below its all-time high of $4,946.05 from August 24, 2025.
The recent outperformance on the rebound follows a period in which Ethereum underperformed Bitcoin during the initial sell-off. Network activity metrics, including transaction counts and decentralized finance volumes, have remained relatively resilient even as spot prices fluctuated. Corporate and institutional accumulation has also continued in the background. One example is Bitmine Immersion Technologies, which has steadily added to its Ether holdings, reaching over 4.9% of total supply. Such treasury strategies illustrate ongoing demand from entities treating Ether as a longer-term reserve asset rather than a pure trading instrument.
Ethereum’s 24-hour range of roughly $2,325 to $2,463 shows it successfully defended support near the lower end of the recent band. Relative strength against Bitcoin has improved modestly over the past day, though the longer-term ETH/BTC ratio remains a focus for traders monitoring capital rotation between the two largest assets.
Inflation Data and Liquidations Drive Near-Term Volatility
The primary catalyst for the midweek decline was the release of September 2026 US inflation figures by the Bureau of Labor Statistics. The Consumer Price Index (CPI) for All Urban Consumers rose 0.6% on a seasonally adjusted basis in September, bringing the 12-month rate to 3.7%. Core CPI, which excludes food and energy, increased 0.3% for the month and 2.6% over the year. These readings exceeded many economists’ expectations and lifted market-implied probabilities of further Federal Reserve tightening before year-end.
Higher interest-rate expectations tend to pressure risk assets, including cryptocurrencies, by raising the opportunity cost of holding non-yielding or lower-yielding instruments and by strengthening the US dollar. The inflation print arrived alongside similar upside surprises in producer prices, reinforcing the narrative that disinflation progress has stalled.
In response, Bitcoin and Ethereum both sold off sharply, with the decline amplified by forced liquidations in leveraged derivatives markets. CoinGlass data indicated total crypto liquidations approached or exceeded $900 million to nearly $1 billion over a 24-hour window on October 15, with the large majority occurring in long positions. Ethereum and Bitcoin together accounted for a substantial share of those liquidations, as leveraged traders were stopped out near the session lows.
Such liquidation cascades are a recurring feature of crypto markets when prices move quickly against concentrated leveraged positions. Once initial stops are triggered, forced selling can push prices lower, hitting additional stops and creating a feedback loop until new buyers absorb the supply. In this instance, the process appeared to exhaust itself near the $79,800–80,000 area for Bitcoin and corresponding support for Ethereum, after which prices recovered. Funding rates in perpetual futures have remained relatively contained post-event, suggesting that extreme one-sided leverage has been reduced for the moment.
Broader market conditions also played a role. Equity markets, particularly in Asia, experienced significant declines around the same period, with some indexes posting large single-day drops. Cryptocurrency prices have shown intermittent correlations with risk assets during periods of macro stress, even as longer-term narratives around digital scarcity and institutional adoption continue to develop. Spot Bitcoin and Ethereum exchange-traded products have seen mixed flows in recent sessions, with some days of net outflows coinciding with the inflation-driven weakness and occasional inflows providing a partial offset.
Read: This Indicator Puts Bitcoin Price at $251K by 2030, $2.2M by 2040
Looking ahead, market participants will monitor subsequent economic releases, Federal Reserve communications, and any shifts in institutional positioning. Bitcoin’s ability to hold above the low $80,000s and Ethereum’s capacity to sustain levels above $2,400 will be watched as near-term technical references. Both assets continue to trade with substantial discounts to their 2025 highs, leaving room for either further consolidation or renewed directional moves depending on incoming data and broader risk sentiment.
Prices remain subject to rapid change. All figures cited for Bitcoin and Ethereum are drawn from CoinGecko snapshots near 05:50 AM UTC on October 16, 2026, and may differ slightly across exchanges and subsequent updates. The information presented is for informational purposes and does not constitute investment advice.
Also read: Saylor’s Strategy & Japan’s Metaplanet Face MSCI Index Removal Under New Bitcoin Treasury Rules