
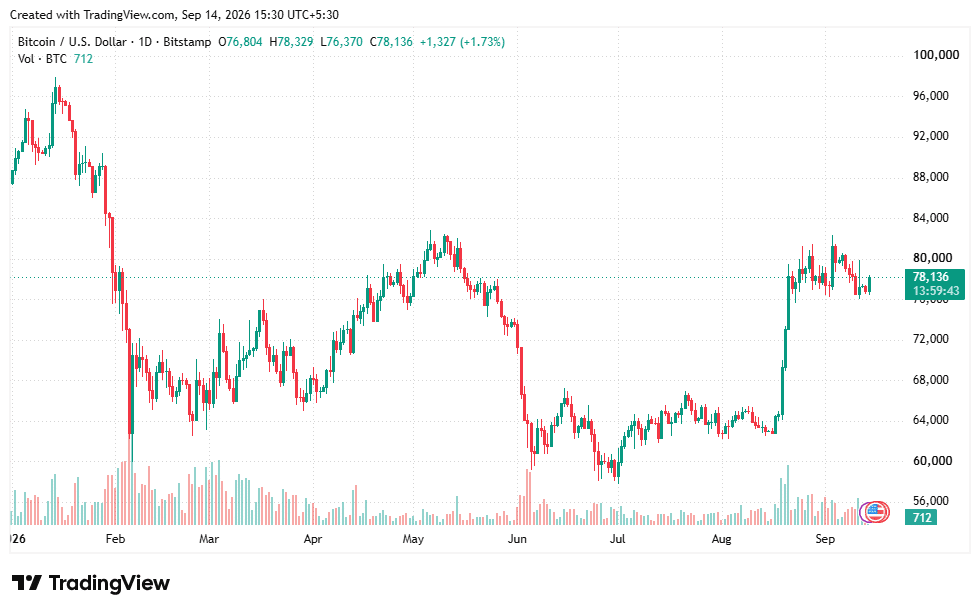
Bitcoin is trading near $78,150 on Monday (as of 10 AM UTC), September 14, 2026, up about 1.9% over 24 hours, with a market capitalization of $1.56 trillion and a 24-hour range between $76,367 and $78,200—as per CoinGecko data.
The YTD chart from TradingView shows a similar print around $77,800. The figure remains well below the October 2025 record of $126,198 and keeps Bitcoin in a tight band after a sharp August rebound that lifted the asset from the low $60,000s toward $81,000.
The week ahead is crowded. The Federal Reserve meets on September 15–16, while traders are still digesting August inflation, Treasury buybacks, and a swing in U.S. spot Bitcoin ETF flows. The debate is no longer only about the last print. It is whether the summer low was a durable floor or only a pause inside a longer correction.
Price action after the August rebound
As reported by The Crypto Times earlier, August produced Bitcoin’s first positive monthly close since 2021 and the strongest calendar month of 2026, with a gain near 25% as ETF demand and a short squeeze pulled price out of the $60,000s. That rally stalled beneath $80,000–$82,000.
Farside Investors data show why the tape then cooled: U.S. spot Bitcoin ETFs recorded $730.8 million of net inflows on September 3, then flipped to outflows of $282.7 million on September 10 and a further $13.2 million on September 11. Cumulative net inflows still stand at about $55.2 billion, led by BlackRock’s IBIT, but recent sessions have not confirmed the late-August pace.
A September range study framed the immediate map as $75,000–$76,500 on the downside, overlapping the active-investor cost basis and the so-called true market mean near $76,350, and $81,000–$86,000 overhead, a zone Glassnode has associated with profitable supply, dealer gamma, and liquidation-related selling. Deeper support sits near $72,000–$73,000 and the 200-day moving average. Those bands still describe the market on September 14: price is holding above the August base, but it has not accepted above $80,000.
Treasury market pressure has been part of the ceiling. Longer-dated yields rose even after a $6 billion long-duration buyback announcement, leaving dollar funding less friendly for a non-yielding asset. That is a mechanical headwind, not a verdict on Bitcoin’s longer-term demand.
Bottom signals and competing analyst views
On-chain “bottom” dashboards do not speak with one voice. Stage Two Research showed a composite bottom indicator at 0% signal strength on September 14, with 0 of 9 conditions confirming. Realized price was listed near $52,779 and the 200-week moving average near $65,045, leaving spot about 1.47 times realized price. Individual readings were mixed rather than washed-out: SOPR near 1.00 carried the strongest single bottom weight on that board, while realized-price and Puell readings were weak.
Glassnode’s Week On-Chain struck a related note from a different angle. The firm said a cluster of bottom signals that had sat in the coldest band for 41 weeks, peaking at an 82% cold share in late June, has since cleared as valuation repaired through the rally. The cold share fell to 2% in the latest full week. The same note said the market has left the deepest value zone without becoming expensive: three-quarters of the tracked indicators still sat below their historical midpoints. That is a description of transition, not a buy or sell call.
Other public views remain split and should be read as such. Coinbase Chief Executive Brian Armstrong called $400,000 by 2030 a reasonable target and said the latest cycle had already found a floor, tying part of the bid to stress in global bond markets. That is a long-horizon corporate view, not a September trading level.
Cycle-timing work published earlier in 2026, including Galaxy Research’s mid-year review of historical bottom markers, argued that several classic trough conditions had not yet clustered and that prior peaks-to-troughs often took 12 to 13 months. From the October 2025 high, that calendar still points into late 2026. Those models can fail when ETF demand, regulation, or liquidity change the cycle. They are included here because they are documented, not because they are settled.
Policy calendar and recent developments
Two market-structure stories sit beside the price. First, U.S. spot Bitcoin ETF flow remains the cleanest daily demand gauge, and Farside’s ledger shows the bid is real but uneven. Second, corporate treasuries have continued to add coins even while spot trades below many average cost bases. Strive reported buying 1,375 BTC on September 4 at an average $79,281, taking holdings to 24,531 BTC.
A separate operational shock hit the Liquid Network in early September, when a cache-collision flaw allowed the minting of thousands of unbacked L-BTC and the withdrawal of roughly 4,000 BTC from federation wallets. On-chain messages followed as actors and Blockstream exchanged return-address confirmations. The episode did not set the spot price by itself, but it is a reminder that sidechain and wrapper risk is distinct from Bitcoin’s base-layer settlement.
The near-term catalyst list is clearer than the bottom call. CPI has already printed. The Federal Reserve decision and projections arrive mid-week. Prediction markets have priced both a touch of the low $80,000s and a revisit of the mid-$70,000s this month. Neither outcome is implied by a single on-chain score.
Bitcoin is therefore holding a recovered range, not a confirmed regime change. The August low area has so far attracted buyers. Overhead supply, cooler ETF prints, and a restrictive rate path still cap the tape.
Also Read: New Bitcoin ATH Prediction: Analyst Puts $232k Price Mark on April 2028 Halving