Solana (SOL) traded near $101.48 on leading crypto exchanges on September 10, 2026 (as of 12:00 PM UTC), after opening at $101.53, reaching a session high of $102.18 and a low of $100.48—as per CoinGecko data.
The current price level leaves SOL just above the $100 area that several independent traders have marked as a decision zone, after a late-August rebound from the mid-$70s.
TradingView’s year-to-date (YTD) chart shows a year defined by a first-quarter decline, a mid-year washout, and a late-summer recovery. Price began the visible window in the mid-$130s to mid-$140s, sold off sharply in February, then spent March through May oscillating mostly between the mid-$70s and the high $90s. A second leg lower in June took the market into the low $60s before a base formed through July and much of August.
The most recent impulse began in late August, lifting SOL from the mid-$70s through $100 and briefly toward $110 before the current pause near $101.48.
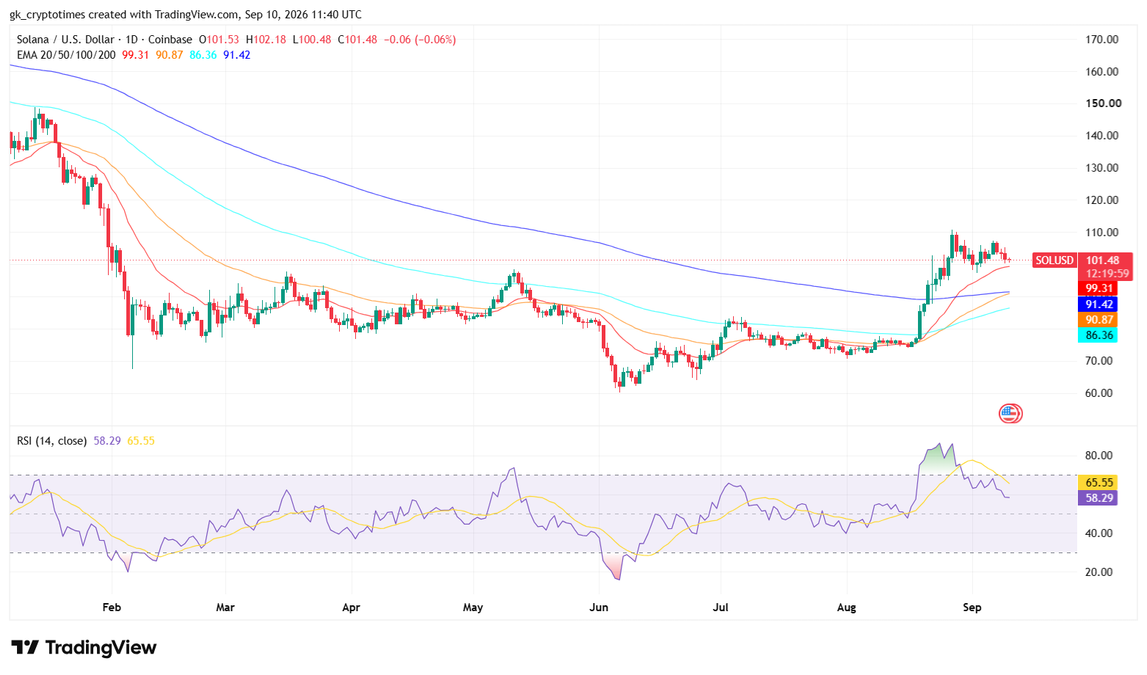
On that same daily chart, price now sits above the 20-day EMA at $99.31, the 50-day EMA at $90.87, the 200-day EMA at $91.42, and the 100-day EMA at $86.36. The 20-day average has turned up and is the nearest dynamic support.
The 14-period RSI is printed at 58.29, with its overlay line at 65.55, after a spike into the 80 area during the late-August rally. That leaves momentum constructive but no longer overbought on the daily close.
The chart therefore aligns with the near-term levels used by Ucan and Crypto Catalysts: price is holding the break above the high $90s, is testing the $100–$102 band, and has not yet resolved the $104–$110 liquidity zone. It does not, by itself, confirm or deny a later move toward $146.56, $500, or $1,000. Those remain the stated views of the individual posters, not conclusions drawn from the year-to-date candle structure.
Analysts map liquidity, structure, and stretch targets
The views below come only from the original posts of three market commentators on X. They are individual observations, not institutional forecasts, and they disagree on both time horizon and magnitude.
On September 10, Crypto Catalysts described SOL as sitting between two liquidation clusters. The account said liquidity “starts getting juicy” around $100, called $104–$105 a “crowded battlefield,” and flagged $108–$110 as another heavy liquidity pocket. Price, in that reading, is stuck in the middle while both sides wait for the other to blink. A clean break, the post argued, could set off a chain of liquidations and turn a slow chart into a fast one. The same note said volume and open interest were the variables to watch.
Three days earlier, on September 3, Ucan framed the same region in structural terms. SOL had broken above $97.70 resistance and was then trading around $105, with the breakout still holding. The next key resistance was placed at $120. A move through $120 would put $146.56 on the watchlist. On the downside, $97.70 was listed as first support and $81.35 as the level below that. The bullish structure, the post said, remains valid as long as price holds above $97.70.
A more aggressive expansion case came from Gerla on September 7. That post said SOL “finally looks like it has completed the manipulation phase” and that the next expansion being watched was toward $500 first, then $1,000. No path, time frame, or invalidation level was specified in the text. That target set sits far above both the current print near $101 and the nearer levels cited by the other two accounts.
Taken together, the three posts describe a short-term range defined by $97.70–$100 on the low side and $104–$120 on the high side, with one commentator treating a completed “manipulation” phase as the start of a much larger move. None of the three posts offered a single consensus year-end number. The nearer technical map is more specific than the long-range expansion case.
Also read: XMR Price Prediction for September 2026: Can Monero Clear $550?