
Bitcoin pulled back from session highs near $82,000 on Coinbase after a two-day surge, leaving traders to decide whether the late-August breakout still stands.
Aggregated market data from CoinGecko put Bitcoin at $81,129 on September 3 and $79,658 on September 4. The largest cryptocurrency hit multi-month high near $81,731 and a low of $78,651, with the session closing near $79,809.
The retreat followed the strongest single-day U.S. spot Bitcoin ETF inflow of September, a $730.8 million net creation on September 3 led by BlackRock’s IBIT. Flows remained positive on September 4 at $174.6 million, after a $236.5 million outflow on September 1.
Bitcoin’s price is still far below the October 2025 peak near $126,000, but well above the mid-August lows in the mid-$60,000s—as marked by CoinGecko data.
Price Tests Breakout Support After the $82,000 Spike
The $81,000–$82,000 area has now rejected Bitcoin twice in two weeks. Glassnode’s Week On-chain report described the late-August push through $80,000 as a relief rally that stalled under long-term overhead supply. An earlier Glassnode note placed the main supply band between $81,000 and $86,000, where cost-basis shelves and liquidation clusters overlap.
Chart-focused traders framed Friday’s tape as a retest, not a breakdown. Analyst Ali Charts on X said Bitcoin had broken a parallel channel on the hourly chart, cleared $80,600, reached $82,280, and was retesting the breakout as support. If $80,600 held, he said, the next objective was $85,000.
Another analyst, Wealthmanager marked a different line. He said Bitcoin had broken a descending structure into the $81,000–$82,000 area and was pulling back to retest $78,800–$79,300. If that zone held as support, he argued, the breakout would remain intact and another push toward $82,000-plus would stay on the table. That lower band matches the September 4 session low more closely than the hourly $80,600 level.
Those two views agree on structure and differ on which floor matters. One treats $80,600 as the invalidation line for the hourly breakout. The other treats the $78,800–$79,300 pocket as the level bulls must defend after the $82,000 rejection.
Analysts Split on Whether the Rally Extends or Unwinds
Not every desk reads the same chart as a bullish retest. Aralez published a four-step plan that starts with sideways trade, a breakout above $83,000, then a pullback below $80,000 toward $75,000. From there he mapped liquidity sweeps at $61,000 and $57,800 and a drop below $50,000 before a bottom forms. He called the latest advance short-lived hype and described it as market manipulation. That path is a forecast, not a print in the price data, and it sits well below the support cited by the other two analysts.
The live tape is narrower than that roadmap. TradingView data shows Bitcoin is holding near $79,627 as of 6:20 AM UTC September 5 after failing $81,000–$82,000.
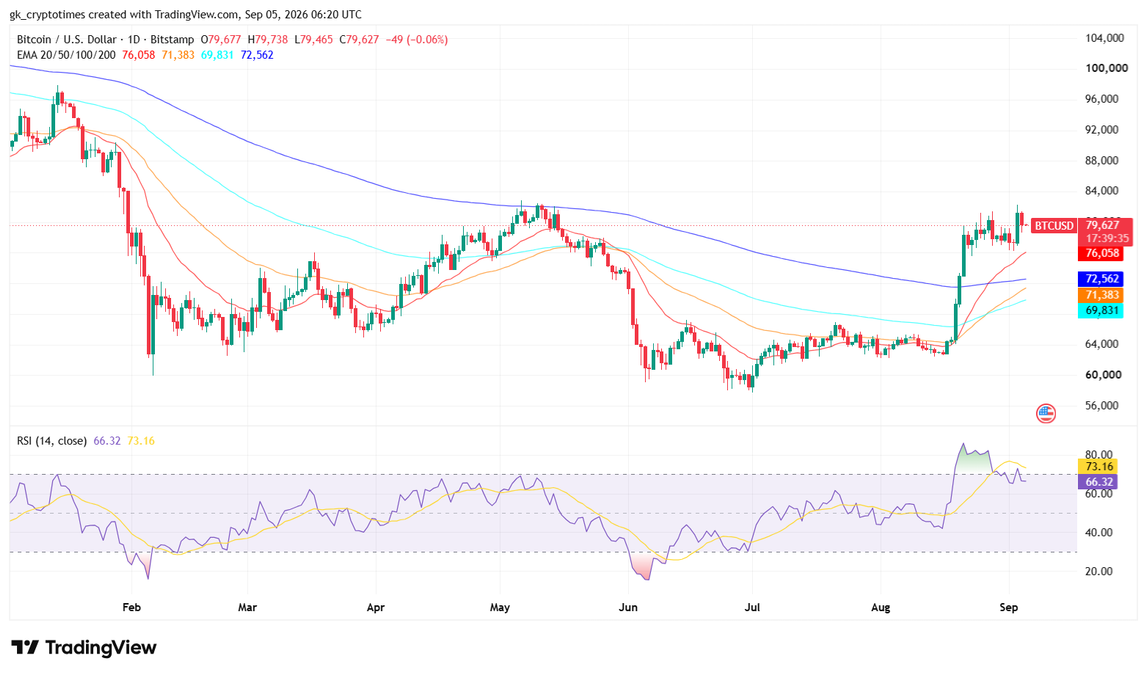
As analysts suggested, a hold of $78,800–$79,300 would keep the August breakout thesis alive. A daily close back through $81,000 would reopen $83,000–$85,000. A loss of the September 4 low would shift attention to the mid-$76,000s first, not immediately to $50,000.
The market is therefore split along a short list of levels: $80,600 on the hourly breakout, $78,800–$79,300 on the daily structure, $81,000–$86,000 as overhead supply, and a much lower liquidity map that only comes into play if those nearer floors fail.
Also read: Bitcoin-Gold Correlation Hits Six-Year High