
Bitcoin is trading near $76,700 as of 1:20 PM UTC – September 2, 2026, after failing to hold above $80,000 during the last week. That rejection has left BTC sitting below a widely watched psychological and technical ceiling.
As per CoinGecko data, the largest cryptocurrency briefly reached about $81,300–$81,400 in late August before sellers stepped in.
Price action over the past two weeks tells a clear story. TradingView’s year-to-date (YTD) chart shows that Bitcoin climbed from the mid-$60,000s in mid-August, fueled by a sharp short squeeze and a rebound in spot ETF demand. It printed local highs near $81,000 on August 25 and again approached that zone later in the month.
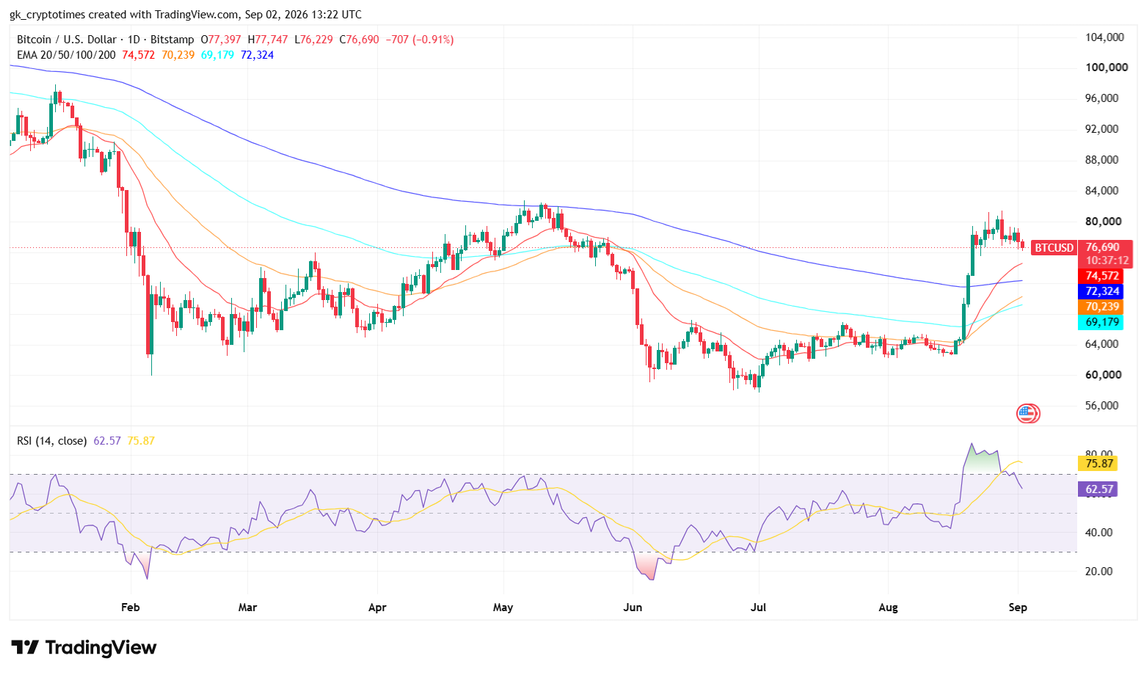
Each attempt to stay above $80,000 met selling. Daily closes have since slipped back toward $77,000, with Tuesday’s session showing a modest decline versus the prior close. Volume remains elevated compared with mid-summer, but momentum indicators have cooled.
Analysts on X note that the $80,000–$81,000 band now functions as resistance. It aligns with the 50-week moving average and earlier supply from this year’s failed rallies. Immediate support sits in the $76,500–$78,000 zone that previously acted as a breakout area.
A clean hold there would keep the August advance intact as a higher-low structure. A decisive break lower would reopen the mid-$70,000s and, for more cautious traders, the $72,000 region.
Market Backdrop Behind the $80,000 Ceiling
Several overlapping factors explain why $80,000 has been hard to clear. Heavy overhead supply between $81,000 and $86,000 has capped follow-through. U.S. spot Bitcoin ETFs recorded strong inflows during the August rebound, including a multi-session streak that totaled more than $3 billion, but those flows later cooled, with a notable $202 million net outflow on August 28. That shift reduced one source of persistent bid.
Macro conditions also matter. Comments from Federal Reserve Chair Kevin Warsh at Jackson Hole raised market odds of another rate increase, tightening financial conditions and weighing on risk assets.
As The Crypto Times reported earlier, treasury buyback plans had helped spark the mid-August bounce by supporting liquidity, yet that impulse has faded as traders wait for incoming inflation data and policy signals.
The August rally itself was amplified by forced covering: billions of dollars in short positions were liquidated as price left the prior range. Liquidation-driven moves often stall once the squeeze ends. Coinglass data shows that open interest remains well below last year’s peak, suggesting positioning is less crowded than at the 2025 high, but that has not yet produced a sustained breakout.
Divided Views From Market Analysts
Traders watching the same chart have drawn different conclusions. On August 28, @kabukistory argued that the rejection at $80,000 completed a “final bull trap.” The account mapped a path from $79,000 toward $67,000 and then $55,000 before any new bull run, citing prior calls on the 2025 peak. That view treats the August rally as the last opportunity to sell rather than the start of a new advance.
A more measured technical read came from @Wealthmanager on September 2. The trader noted rejection from the $81,000 resistance zone, a MACD turn toward bearish, and fading momentum. Another failure at current levels, in this view, could open a move toward $72,000 or lower. The post framed the $81,000 rejection as increasingly dangerous for bulls without claiming an immediate collapse.
@Abelweb33 offered a nearer-term, level-based framework the same day. After repeated failures to hold $80,000, the focus shifted to the $76,500–$77,200 demand zone. The analysts stated that a successful defense could allow a rebound toward $78,500–$79,000. Reclaiming $80,000–$80,600 would improve structure; another rejection would extend the pattern of lower highs. The analysis described the current setup as a test of support, not a confirmed breakdown.
The three takes share one observation: $80,000 has not been accepted as support. They differ on what comes next. One roadmap is sharply lower. Another flags deteriorating momentum and a possible slide toward $72,000. The third treats the $76,500–$77,200 band as the immediate line that decides whether buyers regain control. Price itself will settle the debate. A hold of current support keeps the August rebound viable. A loss of that zone would validate the more cautious readings. Until then, Bitcoin remains range-bound beneath a level that has so far refused to break.
Also read: Capital B Raises €7.6M From Adam Back for Bitcoin Treasury