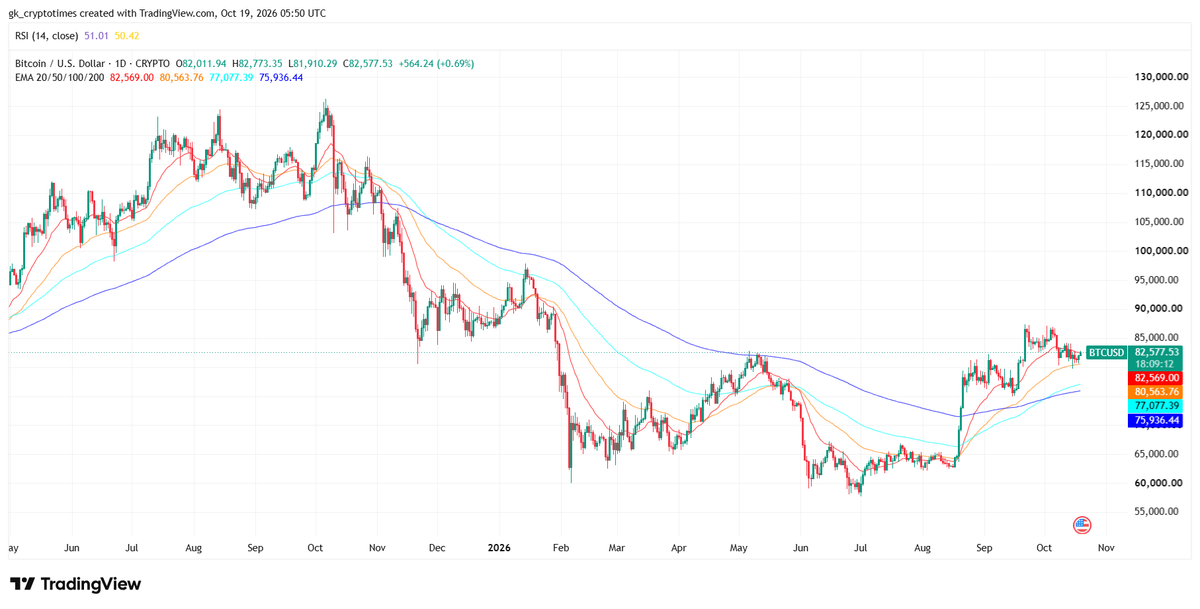
Bitcoin has spent much of October 2026 trading in a relatively narrow band after recovering from summer lows near $58,000 and testing levels around $86,500 earlier in the month.
As of October 19 at 5:45 AM UTC, the asset was holding near $82,620, up 1.2% in the past 24 hours after a brief drawdown during the last week—as shown in CoinGecko price chart. This period of sideways movement has drawn attention to technical indicators pointing to compressed volatility, with market participants watching for signs of an eventual expansion in price swings.
Bitcoin’s Recent Price Path Shows Consolidation After Broader Swings
Bitcoin’s trajectory through mid-to-late 2026 has featured a recovery from June-July lows around $58,000–60,000 followed by a push toward the mid-$80,000s in early October before repeated tests of support near $80,000–81,000.
TradingView’s 1D chart shows daily ranges frequently contained between roughly $80,700 and $84,000 in recent sessions, with volume remaining elevated relative to quieter periods earlier in the year. The asset remains well below its all-time high near $126,200 recorded in October 2025, reflecting a longer-term correction even as shorter-term price action has stabilized.
This consolidation has occurred against a backdrop of macroeconomic influences and derivatives activity. Hotter-than-expected September consumer price index data contributed to a mid-month dip below $81,000, which in turn triggered liquidations across leveraged positions before prices recovered.
Reports of total crypto liquidations reaching hundreds of millions of dollars in single sessions during the week of October 15 illustrate how positioning can amplify moves once a range boundary is tested.
Data from SoSoValue shows spot Bitcoin exchange-traded fund flows have also been mixed, with periods of outflows alternating with modest inflows, limiting sustained institutional buying pressure that previously supported higher levels.
The overall picture is one of reduced directional conviction. Price has repeatedly found buyers near the low $80,000s and sellers near the mid-$80,000s, producing the kind of compressed daily ranges that technical analysts associate with coiling setups. Whether this pattern resolves higher or lower will depend on factors beyond pure price action, including subsequent economic data, ETF activity, and derivatives positioning.
Understanding Bollinger Bands and the Current Squeeze Signal
On October 19, 2026, financial data provider Barchart highlighted on its X account that Bitcoin’s daily chart showed one of the tightest Bollinger Band widths in the preceding 2.5 years, describing the setup as coiling and potentially gearing up for a larger move. The accompanying chart displayed the standard 20-period, two-standard-deviation bands alongside a BandWidth reading near multi-month lows, with price action clustered inside the narrowing envelope. Such compression is commonly referred to as a squeeze; historically it signals that a period of low realized volatility is underway and that a higher-volatility phase is likely to follow at some point, though neither the timing nor the direction of the subsequent move is indicated by the bands alone.
Bollinger Bands, developed by John Bollinger in the early 1980s, are a volatility-based technical analysis tool consisting of a middle band (typically a 20-period simple moving average) and upper and lower bands set a multiple of standard deviations away from that average—most commonly two standard deviations.
In practice, traders monitor for a decisive close outside the bands accompanied by expanding volume as confirmation that the squeeze is resolving. False breaks can and do occur, particularly in markets with significant leverage, so many practitioners combine the observation with other tools such as volume profiles, open interest changes, or on-chain metrics.
The current reading is tight by recent standards, yet some market participants have noted that comparable or lower BandWidth levels have appeared on multiple occasions over the same multi-year window, underscoring that the setup is notable but not unprecedented.
Analyst Perspectives on Implications for Volatility and Direction
On-chain and technical analyst Axel Adler Jr. addressed a similar compression in an October 14 morning brief, observing that BandWidth had narrowed to 4.9% of the average price—its lowest level since mid-September—after halving over the prior week. He identified an upper boundary near $86,000 and a lower boundary near $81,900 as levels that could signal a directional resolution if held on a closing basis.
Adler emphasized that narrow bands indicate market compression without revealing direction or exact timing, and that his Volatility & Flow Index remained below its one-year average, consistent with subdued activity. An improved outlook, he suggested, would require price to hold above the upper boundary alongside an increase in market buys.
Other observers have reached parallel conclusions from different data sets. Studies of Bitcoin’s historical BandWidth behavior show that periods of extreme contraction have been followed by volatility expansions in both directions, with outcomes depending on the broader market regime at the time.
Recent examples include an August 2026 episode in which BandWidth reached multi-month lows before an upside resolution that carried price above $80,000, as well as earlier instances that resolved lower. The presence of leverage in perpetual futures markets can amplify whichever direction ultimately prevails once the range breaks, as evidenced by the liquidation clusters that accompanied the mid-October dip below $81,000.
Broader context includes ongoing sensitivity to U.S. rate expectations and equity-market correlations. Bitcoin’s realized volatility has periodically compressed to levels last seen years earlier, a condition that has historically proved temporary. At the same time, long-term holder supply metrics and short-term holder cost bases continue to provide reference points for potential support or resistance once a larger move develops.
None of these indicators, including the current Bollinger Band configuration, constitutes a directional forecast. They describe a market that has spent recent weeks absorbing prior volatility and is now positioned for a higher-volatility phase whose magnitude and direction remain to be determined by subsequent price action, volume, and external catalysts. Participants monitoring the setup typically wait for confirmation beyond the bands themselves before treating the compression as resolved.
Also read: This Indicator Puts Bitcoin Price at $251K by 2030, $2.2M by 2040