
Key Highlights
- Bitcoin’s Cycle Momentum turns positive after eight months of bearish momentum, signaling a possible bear-market reversal.
- BTC is testing $76,000–$77,000 support, with a break above $78,000 potentially opening the way toward $79,000–$80,000.
- The reversal is not confirmed yet: Bitcoin still needs to reclaim the 50-week moving average, while the Cycle Momentum indicator needs to reach 20–30.
Bitcoin’s Cycle Momentum indicator has reportedly turned positive after eight months of bearish momentum, giving the market a new sign of a possible trend change, according to CryptoQuant contributor Gaah.
The shift came as BTC traded near $77,000 on Wednesday, with the indicator pointing to a possible break from the downtrend and a broader reversal in market conditions.
In a published report on CryptoQuant, Gaah said the move into positive territory signals a “high probability” that BTC could break out of its downtrend and reverse the bear market. However, the signal is not yet confirmed.
For the reversal to be confirmed, Gaah said the indicator needs to climb to between 20 and 30 in the coming weeks while Bitcoin continues to recover in price.
BTC tests key $76K–$77K support level
The change in the indicator comes as Bitcoin faces an important test on the price chart. BTC has fallen back toward the $76,000-$77,000 area after several attempts to move above a descending structure.
At the time of reporting, the asset is trading for $77,381, down a modest 1.04% within the last 24 hours. This area is also where the support level holds, which could decide what happens next in the short term.
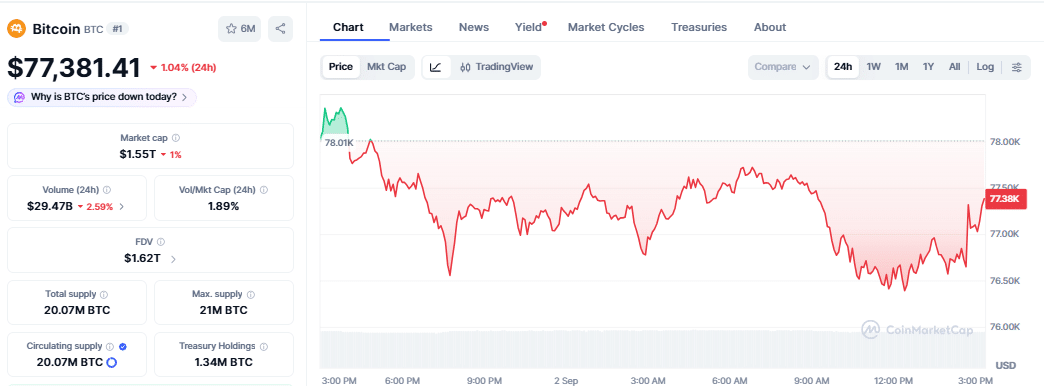
Based on the price action via TradingView as of September 2, if buyers keep Bitcoin above $76,000-$77,000, the current price structure could remain in place. That could give BTC room to move toward about $78,000 and then test the $79,000-$80,000 area.
Analyst warns of a major decision point
Meanwhile, Crypto analyst Wealthmanager described the $76,000-$77,000 area as a major decision point.
A break below the lower part of the structure could instead put more pressure on Bitcoin and expose the market to lower price levels. A brief move below the zone would not necessarily confirm a breakdown, with the chart pointing to a sustained move below the lower channel as the stronger bearish signal.
“Hold here and the next bounce could be sharp but lose this support and the breakdown could get brutal“ Wealthmanager said on X.
Bitcoin still below the 50-week average
Moreover, Bitcoin’s weekly chart shows why the positive momentum reading still needs support from price.
As of September 2 at 2:55 PM UTC, Bitcoin was trading near $77,123, above its 20-day EMA at about $74,610, 50-day EMA at $70,254, 100-day EMA at $69,186 and 200-day EMA at $72,327, according to TradingView.
The 20-day EMA has also moved above the 200-day average as short-term momentum strengthened during the August rally. However, the longer-term averages have not yet formed a fully bullish alignment, leaving the broader trend less conclusive.
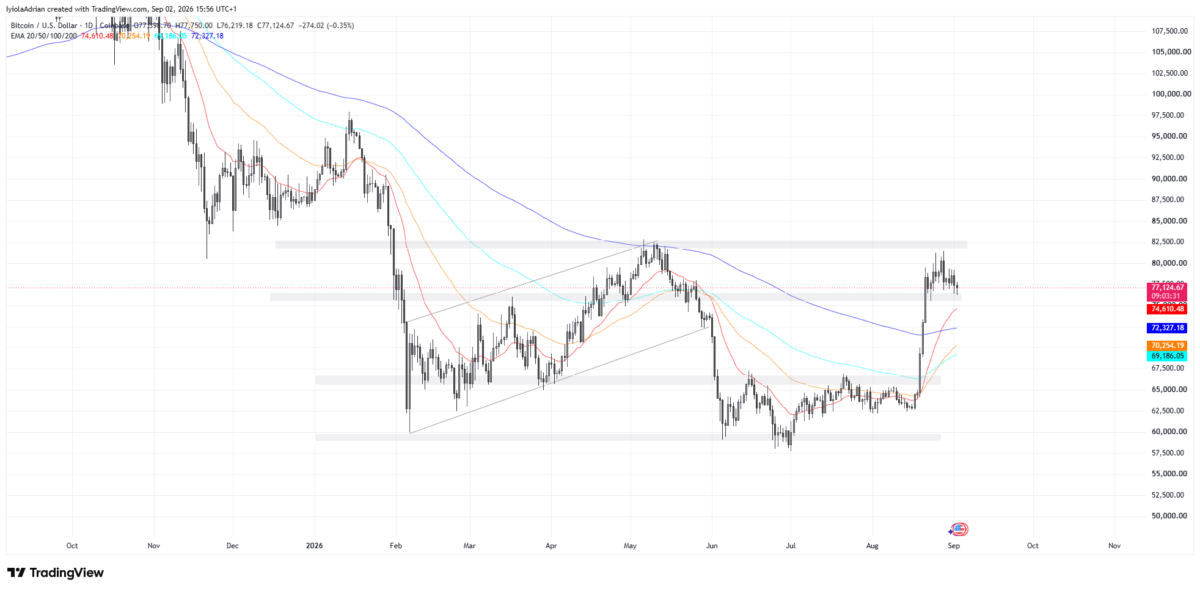
The weekly chart still presents a higher hurdle. At the same 2:55 PM UTC timestamp on September 2, Bitcoin remained below its declining 50-week weighted moving average in the low-$80,000 region, an area that overlaps with resistance above the current price.
Crypto analyst MrTranquility said Bitcoin’s current move should still be viewed as a bear-market recovery unless the cryptocurrency can reclaim the 50-week average. His base case also calls for a lower low in the fourth quarter, although that remains a forecast rather than a confirmed event.
ETF flows and market conditions weigh on BTC
The $80,000 level has also been difficult for Bitcoin to clear because of heavy supply between $81,000 and $86,000.
The Crypto Times recently reported that the strong inflows into U.S. spot Bitcoin ETFs helped support the August recovery, with a multi-session run bringing more than $3 billion into the funds. Those flows later slowed, including a $202 million net outflow on August 28.
Broader market conditions have added another layer to the recovery. Comments from Federal Reserve Chair Kevin Warsh at Jackson Hole raised market expectations of another rate increase, putting pressure on risk assets.
Earlier treasury buyback plans had also helped support liquidity and the mid-August crypto rally, but that effect has since faded as traders wait for new inflation data and policy signals.
What Bitcoin needs for a confirmed reversal
According to the daily chart on TradingView, Bitcoin’s 200-week weighted moving average remains near the low-$60,000 region, where BTC recently found support. A return toward that level would become more important if the current recovery weakens.
For now, the Cycle Momentum indicator has given Bitcoin bulls a fresh signal after eight bearish months. The next test will be whether momentum continues to rise toward the 20-30 range and whether BTC can hold its support and move through the key resistance levels above it.
Also Read: Trump Adviser’s Bitcoin Firm Turns to Buybacks After $372M First-Half Loss