Bitcoin just had one of its worst 24 hours this year. The world’s largest cryptocurrency crashed below the key $60,000 level during New York trading on Wednesday, June 25, hitting a low of $59,023. That is the lowest Bitcoin has traded since October 2024. The price recovered slightly to around $60,800 by Thursday morning in Singapore, but the damage was already done.
In simple terms, Bitcoin (BTC) has now lost more than 50% of its value from its all-time high of $126,277, recorded in October 2025. At the time of writing, BTC is trading around $61,650, and the market is bracing for what could be an even more volatile Friday.
Here is everything that happened with Bitcoin in the last 24 hours and why it matters.
What caused Bitcoin to crash below $60,000?
There was no single event behind Wednesday’s crash. Instead, multiple bad things happened at the same time.
Global tech stocks collapsed. South Korea’s Kospi index crashed 10% on June 23, triggering circuit breakers twice in a single day. Major chipmakers SK Hynix and Samsung fell 12% each. Alphabet (GOOG) and SpaceX (SPCX) stocks also saw sharp declines.
The Nasdaq fell 2.2% and the Philadelphia Semiconductor Index dropped roughly 8%. Since Bitcoin often moves alongside tech stocks, this sell-off dragged crypto down with it.
The US-Iran peace deal fell apart. A ceasefire deal that had been signed on June 19 in Switzerland collapsed after Israel struck southern Lebanon and Iran walked out. This brought back fears of rising oil prices and inflation, which is bad for risky assets like Bitcoin.
The Federal Reserve turned hawkish. At its June 18 meeting, the Fed held interest rates steady at 3.50%-3.75% but removed easing language from the policy statement. The dot plot now shows nine out of 18 members projecting at least one rate hike this year, and the odds of a December hike have repriced to approximately 77%. Higher rates make Bitcoin less attractive because investors can earn safer returns from bonds instead.
Strategy Inc. fears grew. Strategy Inc. (Nasdaq: MSTR), the biggest corporate holder of Bitcoin with over 847,000 BTC, is under growing financial pressure.
According to a CryptoQuant report, published on June 23, the company’s annual dividend obligations have jumped from $300 million at the start of 2026 to approximately $1.2 billion. Its cash reserves have dropped 38% this year, and its STRC preferred shares are stuck below their $100 par value.
CryptoQuant recommended that Strategy should pause Bitcoin purchases and rebuild cash reserves to $2.8 billion. As of June 21, the company’s USD Reserve stands at $1.4 billion, according to its latest SEC filing.
Spot Bitcoin ETF outflows continued. US-listed spot Bitcoin ETFs have posted nearly $3 billion in net outflows in June alone, according to Bloomberg data. On June 23, ETFs saw another $113.8 million in outflows, marking a fourth straight day of withdrawals. BlackRock’s IBIT led the exits with roughly $182 million in outflows, while Fidelity’s FBTC and ARK 21Shares’ ARKB attracted about $23 million and $31 million, respectively.
Bitcoin breaks below the 200-week moving average
One of the most worrying signals from Wednesday’s crash is that Bitcoin fell below its 200-week simple moving average, which currently sits near $62,276, according to Bloomberg data.
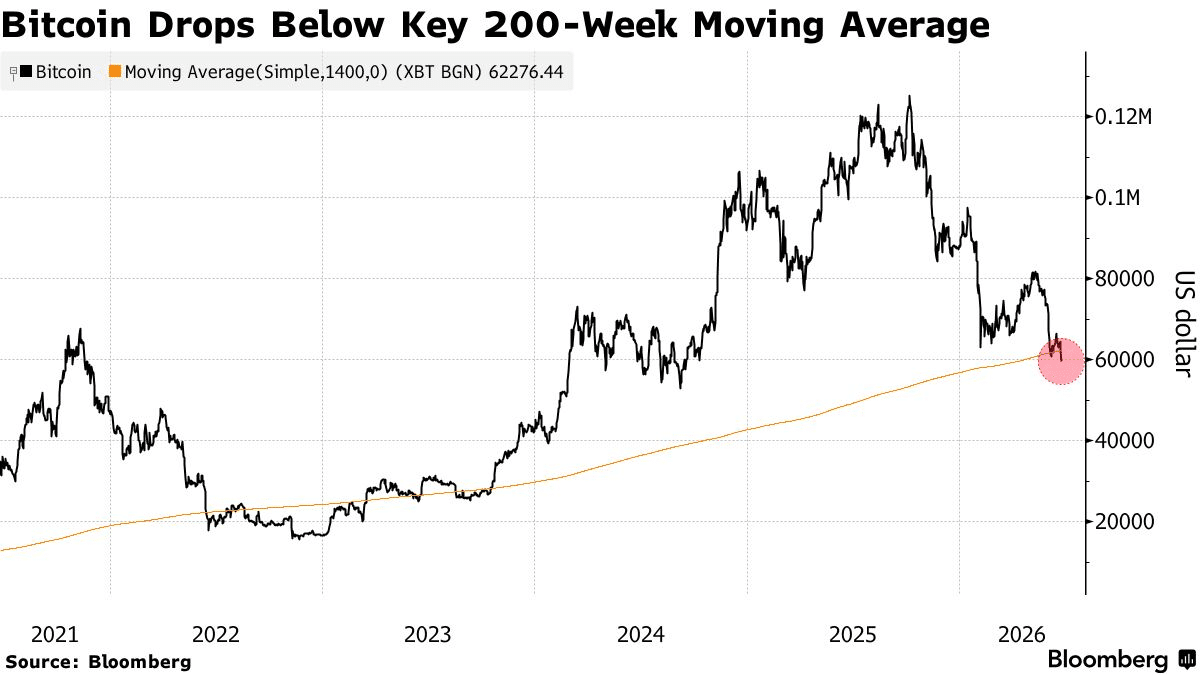
For those unfamiliar with this term, the 200-week moving average is basically a line on a chart that shows the average price of Bitcoin over the last 200 weeks (about four years). It is considered one of the most important long-term indicators in crypto.
When Bitcoin trades below this line, it has historically meant the market is in a prolonged bear phase. The last time BTC spent significant time below this level was during the 2022 bear market, when prices eventually bottomed near $15,500.
Nearly $1 billion liquidated in 24 hours
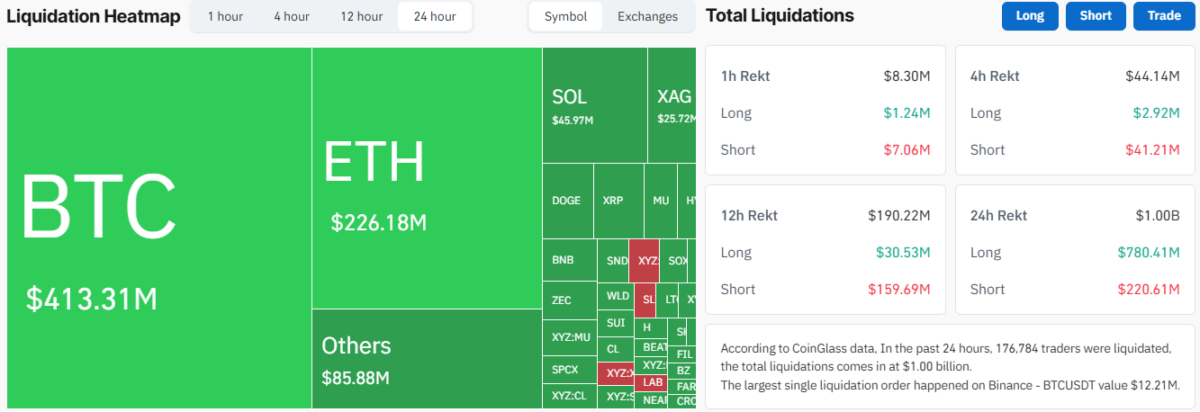
The sell-off wiped out a massive amount of leveraged positions. According to CoinGlass data, approximately $999.06 million in total crypto positions were liquidated in the past 24 hours. A total of 176,832 traders got wiped out.
Here is how the liquidation numbers break down:
- Total 24-hour liquidations: $999.06 million. Longs (traders betting the price would go up) lost $780.98 million. Shorts (traders betting the price would go down) lost $218.08 million. The largest single liquidation happened on Binance, a BTCUSDT position worth $12.21 million.
- By asset: Bitcoin accounted for $413.31 million in liquidations, followed by Ethereum at $226.18 million, SOL at $45.97 million, XAG at $25.72 million, and remaining altcoins at $85.88 million.
- Bitcoin-specific liquidations: In the 24-hour window, $319.4 million in Bitcoin long positions were liquidated compared to $93.42 million in shorts. This shows that most traders were betting on Bitcoin going up, and they got caught on the wrong side.
- Shorter timeframes: In the 12-hour window, $190.26 million total was liquidated ($31.87 million in longs and $158.38 million in shorts). In the 4-hour window, $42.04 million was wiped out ($3.29 million longs, $38.75 million shorts). In the 1-hour window, $7.82 million was liquidated ($1.54 million longs, $6.29 million shorts).
Liquidation happens when traders using leverage see their positions automatically closed after the market moves significantly against them. During sharp selloffs, a wave of liquidations can trigger additional selling pressure, creating a chain reaction that pushes prices lower.
The $10 billion options expiry explained
On top of everything that happened this week, Bitcoin is now heading into a massive options expiry event.
About $10 billion worth of Bitcoin options contracts are set to expire on Deribit, the world’s largest crypto options exchange, at 4 p.m. Friday (June 27) in Singapore. This is the biggest quarterly options settlement of 2026, representing roughly 37% of all active contracts on the platform.
Here is why this matters: Most of these contracts were bullish bets (called “calls”) placed when traders expected Bitcoin to go higher. But with Bitcoin now trading around $60,000-$61,000, these bets are worthless. At the same time, bearish bets (called “puts”) clustered around $60,000-$65,000 and $70,000-$75,000 are positioned to pay off.
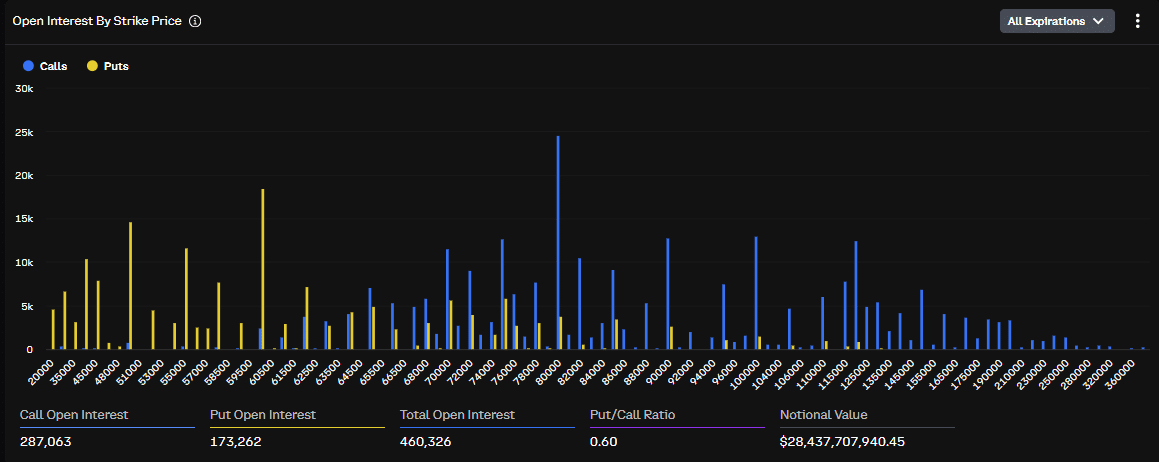
The max pain price for this expiry sits at $72,000, about 15% above current prices. Max pain is the price level where the most option holders lose money. The put-to-call ratio is 0.83, meaning there were more bullish bets than bearish ones, but those bullish bets are now deep underwater.
The PCE inflation data could make things worse
Adding more uncertainty, the May core PCE data (the Federal Reserve’s preferred inflation measure) is scheduled for release on Thursday, June 26.
The report is expected to show price pressures at their strongest since May 2024. The last PCE report showed headline PCE rising 3.8% year-over-year in April, nearly double the 2% target, while core held at 3.3%, its highest since October 2023.
Thursday’s release covers May data and follows a 6.5% annual jump in producer prices, the fastest since November 2022, driven by energy costs tied to the Iran conflict.
If the numbers come in hotter than expected, it will further reduce the chances of any rate cuts this year and could trigger another round of selling across bonds, stocks, and crypto. In simple terms, if inflation comes in high, expect more pain for Bitcoin.
What to watch next
The next 48 hours are critical for Bitcoin:
- Thursday, June 26: The May core PCE inflation data drops. A hot reading could push Bitcoin back below $59,000. A softer reading could offer a relief bounce.
- Friday, June 27: Deribit settles $10 billion in options at 08:00 UTC. Once these contracts clear, traders head into thin weekend liquidity, which could amplify any price move in either direction.
- First week of July: According to multiple analysts, this is when the real test comes. Once the quarterly book is cleared, leverage is reduced, and fresh positioning begins, the market will get a clearer picture of whether this sell-off is a temporary flush or the start of a deeper correction.
For now, the $59,000-$60,000 zone is the most important support level. A clean break below it could open the door to further drops toward $55,000 or even lower. On the upside, the $72,000 max pain level and the $80,000 call wall both stand as strong resistance.
Bitcoin’s price action remains highly volatile. This article is for informational purposes only and does not constitute financial advice.
Also Read: Dave Portnoy Questions Bitcoin’s $1M Future as Price Drops Below $60K