
Key Highlights
- Bitcoin dropped below the key $60,000 psychological support level.
- BTC fell nearly 4.3% in 24 hours, touching around $59,754.
- Spot Bitcoin ETFs recorded major outflows, weighing on investor sentiment.
Bitcoin (BTC) has tumbled below the psychologically important $60,000 level, hitting $59,754.64, according to the latest market data, a 4.29% decline in the past 24 hours.
The one-week chart shows a volatile downtrend marked by red candles, reflecting sustained selling pressure across the crypto market.
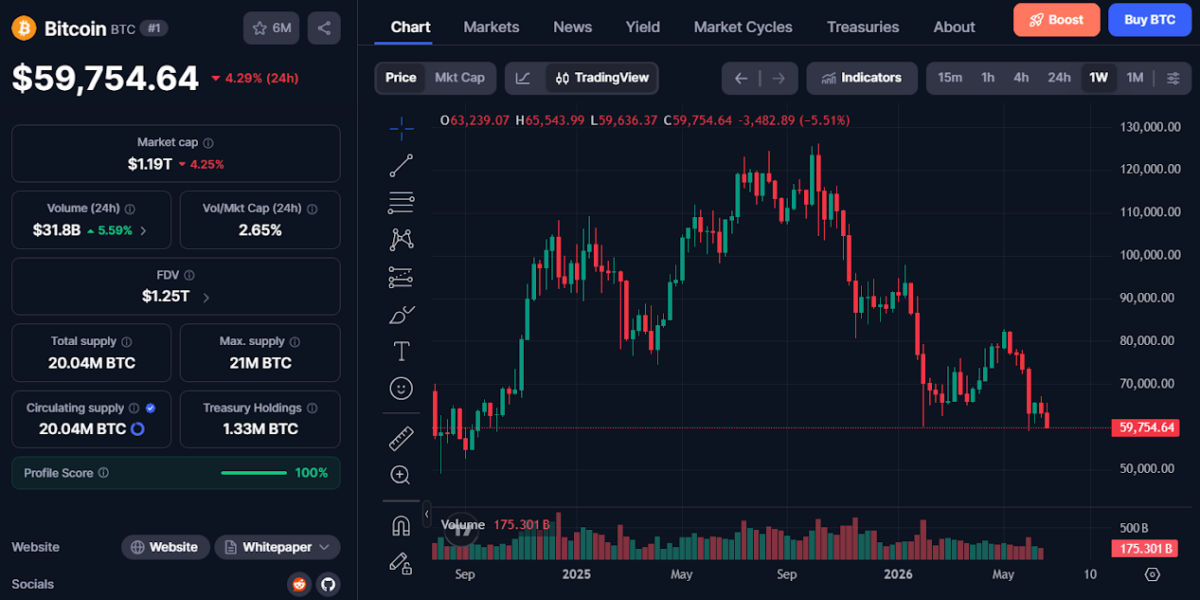
This latest drop marks one of Bitcoin’s weakest points in recent months, extending a broader correction that has seen the leading cryptocurrency shed significant value from its 2025 highs. Several factors have contributed to the drop, such as persistent outflows from spot Bitcoin ETFs, institutional profit-taking, and shifting investor sentiment toward other high-growth sectors like artificial intelligence stocks.
Persistent ETF outflows become a major factor
Reports highlight record ETF outflows, with investors rotating capital away from crypto into traditional risk assets. According to the latest CoinGlass data (as of June 23, 11:50 PM UTC), daily total net inflow stood at negative $113.80 million (-1.78K BTC).
Recent trading sessions have recorded persistent outflows, with individual funds such as IBIT seeing notable redemptions. These withdrawals reflect broader investor caution toward Bitcoin ETFs. Moreover, the earlier decision by major corporate holder Strategy to sell Bitcoin for the first time in years further dented market confidence.
Bitcoin panic selling has begun
According to a recent market analysis by CryptoQuant contributor Darkfost, the latest drop below $60,000 has triggered an immediate wave of panic selling, leading to a massive spike in exchange inflows. The data reveals that average monthly inflows to Binance have effectively doubled since April 13, surging from 3,880 BTC to 7,600 BTC.
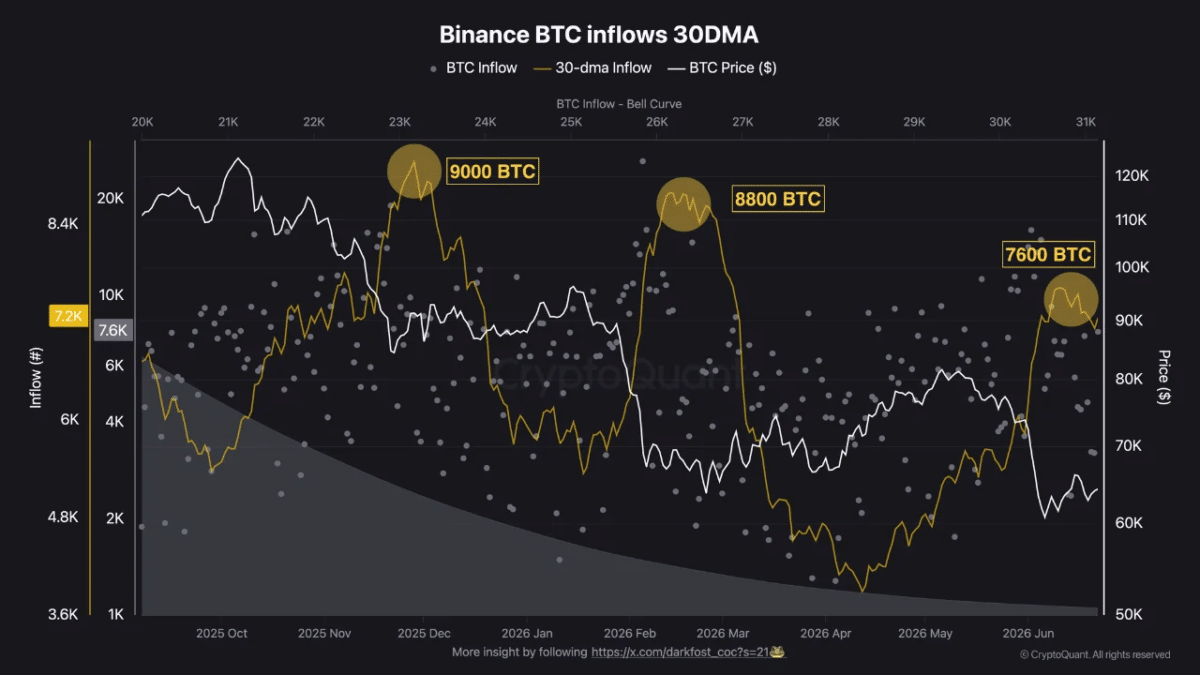
This reactive behavior aligns with historical patterns observed throughout this market downturn. The analyst pointed out that previous breaches of key psychological support levels have triggered identical investor reflexes:
- November 2025: When Bitcoin fell to $84,000, average Binance inflows climbed past 9,000 BTC.
- February 2026: A retest of the $60,000 mark saw inflows hit 8,800 BTC.
Currently, these elevated inflows present substantial short-term sell-side pressure. With 7,600 BTC moving onto Binance at an average price of around $63,000, approximately $479 million in potential sell pressure is sitting on a single platform.
Heavy liquidations add to the pressure
Leveraged positions faced heavy liquidations, accelerating the downside move. According to the latest CoinGlass data, over $660 million in crypto positions were liquidated in the past 24 hours, with Bitcoin accounting for a significant portion.
Long positions bore the brunt of the losses, with approximately $591 million liquidated compared with about $70 million in short positions. More than 140,000 traders were liquidated globally. The heavy long liquidations accelerated Bitcoin’s drop below $60,000, creating a cascading effect as leveraged bets were forcibly closed amid weakening spot demand.
Bitcoin could be undergoing a correction
A break below $60,000 raises concerns about further downside toward support levels around $57,000–$55,000. However, this can be a healthy correction within a longer-term bull cycle rather than the start of a deep bear market.
Bitcoin has rebounded from major support zones during previous market cycles, although past performance does not guarantee future results. For retail investors, heightened volatility underscores the importance of risk management.
Those with long-term horizons may see current prices as a potential accumulation opportunity, especially given Bitcoin’s historical pattern of recovering from significant drawdowns. Institutional interest remains, with some corporations continuing to add BTC to their balance sheets despite short-term noise.
What to watch in the coming weeks
The coming weeks will be critical. Key factors to watch include the following:
- ETF flow trends
- Macroeconomic developments (inflation data, Fed decisions)
- Regulatory clarity in major jurisdictions like the EU under MiCA
- Overall risk appetite in global markets
While the move below $60,000 has intensified short-term concerns, it also reflects the volatility that has historically characterized cryptocurrency markets. Investors are advised to remain focused on risk management and verified information as market conditions evolve.
Also Read: Banks Accelerate Stablecoin Push as Adoption Gains Momentum: Inch