
An 848,000-coin Bitcoin stack, a market that has stopped paying a premium for it, and a capital structure that now includes billions in preferred stock shape Strategy’s path from late 2026 to 2030.
Strategy, the company formerly known as MicroStrategy, closed at $151.47 on October 8, 2026, about 11% below its October 2 intraday high, with Bitcoin rejecting the high $80,000s and trading near 80,000–82,000.
As of publishing, the firm reported 848,000 BTC as of October 4, bought at an aggregate cost of about $63.97 billion, or roughly $75,400 per coin, with live Bitcoin net asset value was about $70.2 billion.
On an assumed diluted share count of about 451.6 million, that is roughly 0.00188 BTC per share. Market capitalization sat near $68.4 billion, a market-cap mNAV of about 0.97× — a small discount to the coins, not the multiple-of-NAV premium the stock carried in prior cycles.
What is Strategy (MSTR) and how it connects to Bitcoin?
Strategy Inc. is a publicly traded firm led by executive chairman Michael Saylor that has repositioned itself as a Bitcoin treasury company. Since its first purchase in August 2020, it has used proceeds from common equity sales, preferred stock such as STRC, and debt to accumulate Bitcoin as its primary reserve asset, while still operating a smaller enterprise analytics software business.
As of early October 2026, Strategy held about 848,000 BTC—roughly 4% of Bitcoin’s fixed 21 million-coin supply—acquired for approximately $64 billion at an average cost near $75,400 per coin, making it the largest corporate holder of the asset. That accumulation model supports Bitcoin demand by converting capital raised in traditional markets into ongoing spot purchases.
When Strategy sells shares or preferred securities and deploys the proceeds into bitcoin, it adds a large, recurring buyer that does not depend on retail trading flows. The scale of those purchases—often hundreds or thousands of coins in a single week—removes supply from the market and has encouraged other companies and investors to treat Bitcoin as a corporate reserve asset, reinforcing institutional demand even as Strategy also maintains dollar reserves to service dividends and interest on its capital structure.
MSTR Technical Analysis
Strategy (MSTR) is trading under most of its long-term weekly moving averages after a failed push into the high $160s. On the weekly chart, the latest candle opened at $164.68, tagged $168.73, and closed at $151.47, down $8.54, or 5.34%, with the low at $147.37. That leaves the stock below the 50-week EMA near $161.50, the 200-week EMA near $167.49, and the 100-week EMA near $184.48, and above only the 20-week EMA near $134.59—as shown in TradingView’s 5-year chart.
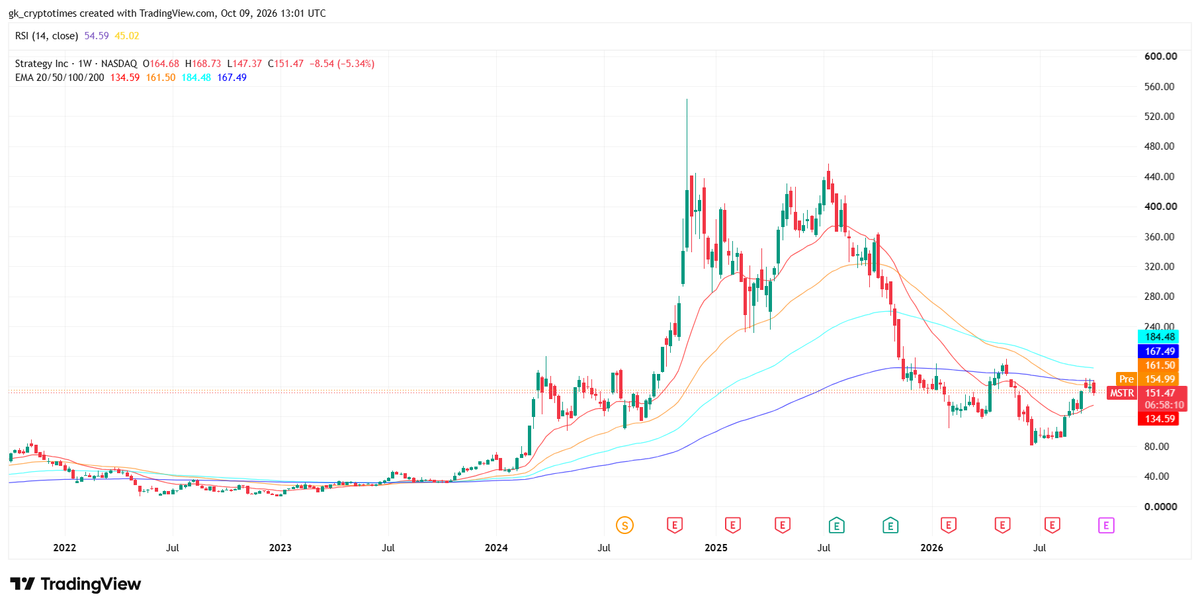
The stack is bearish: the faster average is still the lowest of the four, and price has not reclaimed the cluster of longer averages that capped rallies through the spring and summer. Weekly RSI sits in the mid-range, around 45–55, so the move is not an oversold washout and not a momentum breakout. The structure since the late-2024 peak above $500 is a series of lower highs, with the 2026 rebound stalling under $170.
Near-term levels are tight. Support is the weekly low at $147.37, then the rising 20-week EMA around $135, which caught the mid-2026 selloff. A weekly close under $147 would put that average back in play and reopen the path toward the 2026 lows. On the upside, 162–168 is the first supply zone, where the 50-week and 200-week EMAs now sit on top of this week’s high. A close back above $168 would be the first sign the bounce is more than a flex rally. Until that happens,the weekly trend remains down, and rallies into the mid-$160s are resistance rather than confirmation.
MSTR Price Prediction
Wall Street’s published work is mostly a 12-month exercise. Recent consensus targets cluster around 230–260, with published highs near $435 and lows near $160. None of those notes is a 2030 model. The bands below are scenarios, not targets. They scale from today’s coin-per-share math, the drag of debt and preferred claims, and the open question of whether new share issuance still increases Bitcoin per share.
| Horizon | Bear | Base | Bull |
|---|---|---|---|
| Remainder of 2026 | 90–140 | 150–240 | 250–400 |
| 2027 | 80–170 | 200–420 | 450–850 |
| 2028–2029 | 70–200 | 250–650 | 700–1,500 |
| 2030 | 40–180 | 200–700 | 800–2,500 |
A new post-split all-time high, the late-2024 area near $540, sits inside the 2027 bull band and is a base-case outcome only if Bitcoin re-rates and the common share keeps its claim on the stack. The 2030 bull band is where a multiple of that old high becomes arithmetic rather than narrative. The bear band is where dilution, preferred obligations, and a stagnant Bitcoin price leave the common stock below today’s quote even four years out.
Strategy (MSTR) Price Prediction 2026
The base band for the rest of 2026 is 150–240. It assumes Bitcoin holds a rough $70,000-120,000 range, Strategy keeps adding coins in small weekly clips rather than selling the stack, and mNAV stays between about 0.9× and 1.3×. That is enough to revisit the low $200s that several desks already publish as 12-month targets, without requiring a new premium cycle.
The bear band, 90–140, is a continuation of the tape already in place: Bitcoin fails to hold the low $80,000s, at-the-market common issuance keeps running, and the market refuses to pay even par for the coins because preferred stock and converts sit ahead of the common.
Enterprise-value mNAV was already about 1.20× in early October, against a market-cap mNAV just under 1×. If investors mark the equity off the residual after roughly $6.8 billion of debt and about $14.4 billion of preferred liquidation value, a further discount is not a tail event. A USD reserve of about $5.1 billion, sized to cover at least a year of preferred dividends and interest, delays forced selling. It does not erase the claim.
The bull band, $250–400, needs Bitcoin back through the prior cycle highs and a modest reopening of the premium, toward 1.3–1.6× on market cap. That happened before, when mNAV peaked around 6.5×. It is not the base case for a stock that has spent recent months near or below the value of its own treasury. Software revenue remains too small to move the equity. A $1,000 move in Bitcoin changes gross reserve value by about $848 million at the current stack. The share price will keep tracking that sensitivity, scaled by dilution and by whatever multiple the market assigns.
Strategy (MSTR) Price Prediction 2027
The 2027 base band is 200–420. It assumes Bitcoin trades in a $120,000–200,000 zone for a meaningful part of the year, holdings drift toward 950,000–1.05 million BTC, and assumed diluted shares rise, but not fast enough to erase the gain in coin value. Bitcoin per diluted share stays in a rough 0.0016–0.0021 range. At a 1× mNAV, 0.0019 BTC is worth about $190 at $100,000 Bitcoin and about $380 at $200,000, before netting senior claims. Those claims, if they stay near today’s mid-teens of billions net of cash reserves, subtract on the order of 20–40 per share. The base band is arithmetic with a small premium or discount around it.
The bear band, $80–170, is a year in which Bitcoin round-trips into the $60,000s, Strategy sells coins under its monetization program to fund preferred dividends and buybacks — it already sold thousands of BTC in the summer of 2026 for that purpose — and common issuance continues at prices below NAV. In late September, a 1,665 BTC purchase funded by 1.47 million new shares left assumed-diluted sats per share slightly lower on the week. Repeat that pattern into a soft Bitcoin tape and the common stock can finish 2027 below the October 2026 print even if the headline stack is larger.
The bull band, $450–850, is where the late-2024 high gives way. It needs Bitcoin sustained above $200,000, issuance that is accretive in Bitcoin-per-share terms, and mNAV back above 1.3× because equity and credit investors again treat Strategy as the cleanest listed claim on a growing corporate stack. Convertible overhang matters here. Assumed diluted shares already fold in converts, preferred conversion features, and equity awards. A sharp rally that forces conversion increases the share count and caps the per-share gain. The bull band assumes that conversion is more than offset by coins bought with the proceeds.
Strategy (MSTR) Price Prediction 2028–2029
The base band for 2028–2029 is $250–650. By then the question is no longer whether Strategy owns a large share of the 21 million coin cap — 848,000 BTC is already about 4% — but whether the common equity still owns a growing slice of that claim. A base path has holdings in a 1.05–1.25 million BTC range, Bitcoin in a $150,000–300,000 band, and mNAV oscillating between 0.9× and 1.4× as index inclusion, credit spreads on the preferreds, and ETF competition for Bitcoin exposure take turns dominating the multiple.
These two years are also when the preferred stack either proves durable or becomes the story. STRC and the related preferreds pay a cash obligation that the software business cannot cover. The board policy of holding at least 12 months of preferred dividends and interest in dollars is a buffer, not a business model.
If Bitcoin is higher and the common trades at a premium, Strategy can fund those coupons with ATM equity and still raise Bitcoin per share. If the common trades at a discount, equity funding is dilutive and coin sales become the residual tool. The base band assumes the first regime more often than the second, with drawdowns that revisit the $250s when the second regime appears.
The bear band, $70–200, is a prolonged Bitcoin plateau or a deep drawdown into the 40,000–80,000 area, combined with a preferred burden that forces net coin sales. Holdings could stall or slip. A lower stack at a lower coin price, divided by a higher share count, does not need a crisis to produce a stock in double or low triple digits. The bull band, $700–1,500, requires Bitcoin in the $300,000–500,000 area and a stack still expanding. At 0.0018 BTC per share and a 1.2× multiple, $400,000 Bitcoin is about $860 before liability adjustments. Stretch the coin, the per-share balance, or the multiple and the band’s top is in reach. None of those stretches is implied by today’s discount.
Strategy (MSTR) Price Prediction 2030
The 2030 base band is $200–700. It treats Strategy as a listed Bitcoin holding company whose common equity is worth the coins, minus debt and preferred claims, times a multiple that spends most of its time between 0.8× and 1.3×. Bitcoin in a $150,000–300,000 range, holdings of 1.0–1.3 million BTC, and diluted shares that have grown but not doubled again from the 2026 base produce a stock that can be several times the October 2026 price without matching the most aggressive public Bitcoin calls.
Public long-range Bitcoin work sits well above that base. ARK Invest’s recent base case has put Bitcoin around 710,000–800,000 by the end of the decade, with bull cases above $1 million. A separate May 2026 sketch, using a median historical multiple to Bitcoin’s four-year moving average, put a stack near today’s size at about $388 billion by 2030, implying a coin price in the mid-400,000s. Those figures are inputs to the bull band, not the base.
At 1.1 million BTC, $500,000 Bitcoin, 550 million diluted shares, and a 1.2× mNAV, the common is on the order of $1,200 before a fuller liability haircut. At $800,000 Bitcoin and a richer multiple, $2,000-plus is arithmetic. The bull band of $800–2,500 is that family of outcomes. It is not a forecast that those outcomes occur.
The bear band, $40–180, is the path where Bitcoin is not a monetary asset that institutions keep bidding, the preferred dividend becomes a structural seller of coins, and the market continues to capitalize the common below the treasury. A 2030 price near or below the 2026 quote is possible if Bitcoin is near Strategy’s cost basis and the share count is materially higher. The 2021 and 2024 peaks do not rule that out.
Conditions behind Strategy’s Bitcoin bid and rise in MSTR price
Three conditions carry the bands above. None is a headline. All are measurable.
First, Bitcoin per diluted share has to stop leaking. Weekly purchases that are smaller than the coins implied by new shares, converts, and preferred features leave holders with more total Bitcoin at the corporate level and less per share. Late-September 2026 was a clean example: holdings rose 0.2%, assumed diluted shares rose about 0.3%, and sats per diluted share fell. The base and bull bands assume that pattern reverses often enough that per-share exposure in 2030 is flat to higher than 0.00188 BTC. The bear band assumes it does not.
Second, the preferred and debt stack has to be serviced without a structural coin bleed. Interest plus preferred dividends have to be covered by dollars on hand, by equity issued at a premium to NAV, or by operating cash that remains negligible next to the treasury. A reserve policy of at least 12 months of coverage buys time. It does not buy a decade. If servicing the capital structure requires selling Bitcoin into weakness, every band shifts down, because the asset that justifies the equity is the asset being sold.
Third, mNAV has to have a floor. A discount near 1× can close without a new narrative. A discount that deepens toward 0.6–0.7× on market cap, which some third-party trackers have already printed on different share-count definitions, means the market is charging a conglomerate penalty for leverage, governance, and dilution. The bull band needs the opposite: a durable premium, because investors want Bitcoin exposure inside an equity wrapper and will pay for the embedded leverage. That premium existed when the stack was smaller. It is a choice the market has recently declined to make.
Without those three, the bull band is unsupported. The stock can still trade, and the stack can still be the largest corporate holding in Bitcoin. The common share would simply be a shrinking claim on it.
Risks that cut across the bands
Dilution is the risk that does not require a Bitcoin crash. Basic shares moved from roughly 246 million at the end of 2024 into the low 400 millions by the autumn of 2026. Assumed diluted shares sit higher still, near 452 million. ATM programs, convert settlements, and preferred issuance can keep that count rising in every Bitcoin regime. Buying more coins with the proceeds feels like progress on the company blog and can be a loss for the holder of an already-issued share.
Capital-structure risk is the second cut. Debt of about $6.8 billion is manageable against a $70 billion treasury at October 2026 prices and is not manageable if Bitcoin revisits levels far below the $75,400 average cost for a long stretch. Preferred stock, at about $14.4 billion of liquidation value, is the larger ongoing claim. Coupons do not flex with the coin price. The summer of 2026 already showed management selling BTC to fund preferred dividends and STRC repurchases. A policy that allows monetization of the treasury is a safety valve for creditors and a leak for common holders.
Bitcoin-price risk dominates the variance. Strategy’s software business cannot offset a multi-year bear market. Custody, regulatory treatment of corporate Bitcoin, and index rules that might limit how much of a single coin a listed company can hold are slower risks, but they cap the multiple even if the coin rises. Competition cuts the other way: spot Bitcoin ETFs already give investors direct exposure without dilution or preferred coupons. MSTR outperforms those products only when the premium returns or when per-share holdings rise faster than the coin. In a discount regime it underperforms the asset it exists to hold.
Governance and key-person risk sit underneath all of this. The strategy is concentrated in one capital-allocation choice and one executive franchise. A shift toward returning capital, a forced simplification by creditors, or a change in control would reprice the common long before 2030. Macro liquidity does the same job on a shorter clock. The October 2026 pullback, an 11% drop from the weekly high as Bitcoin failed at $87,000, was a small version of that transmission.
The announcements that matter between now and 2030 are not product launches. They are 8-Ks: coins bought, coins sold, shares issued, and the resulting Bitcoin per share. Scenario bands are descriptions of those filings plus a Bitcoin path. They are not price targets.
This article is for information only and is not investment, legal, or tax advice. Equities tied to crypto assets are volatile. Scenario bands are not price targets, and past performance, including the late-2024 high, does not indicate future results.
Also read: Cardano (ADA) Price Prediction 2026, 2027-2030: Can It Hit a New All-Time High?