
Key Highlights
- Ethereum fell to $2,553.64 on October 7, extending its daily loss beyond 5% after opening near $2,697.
- ETH liquidations reached $232.67 million over 24 hours, including $221.18 million in long positions, or just over 95% of the total.
- Ether is now testing its 50-day simple moving average near $2,546, while rising Treasury yields, oil prices and the U.S. dollar add pressure ahead of the Federal Reserve minutes.
Ethereum extended its selloff on Wednesday, falling more than 5% and breaking decisively below $2,600 as leveraged traders betting on higher prices were forced out of the market.
At 13:39 UTC on October 7, ETH was trading at $2,554.17, down 5.31% on the day, according to TradingView data. Ether opened at $2,697.42, briefly reached $2,699.39 and fell as low as $2,553.64.
The latest decline marks a sharp acceleration from earlier Wednesday, when The Crypto Times reported ETH near $2,616 after the first major round of liquidations pushed the token below $2,600.
Bitcoin was also under pressure, falling below $84,000 during the wider crypto selloff. The Crypto Times earlier reported that Bitcoin and Ethereum were leading the liquidation wave across major digital assets.
Ethereum Liquidations Reach $232.7 Million
The latest CoinGlass liquidation data showed $232.67 million worth of ETH positions liquidated over 24 hours.
Long positions accounted for $221.18 million, or 95.06% of the total, while short liquidations stood at only $11.49 million. The imbalance shows that the selloff overwhelmingly hit traders positioned for Ethereum to continue higher.
The liquidation pressure remained concentrated in the latest part of the decline. Over 12 hours, $225.49 million in ETH positions were wiped out, including $215.38 million in longs. The four-hour total stood at $58.70 million, while another $15.68 million was liquidated within one hour.
The largest single liquidation was a $26.64 million ETH position. Binance accounted for $112.42 million of the 24-hour total, or 48.32%, followed by Gate with about $29.40 million and Hyperliquid with roughly $27.05 million.
CoinGlass classified Ethereum’s liquidation volume at 3.49 times its seven-day average, putting the current deleveraging in its “Extreme” range.
Forced liquidation of leveraged longs can intensify a decline because exchanges automatically close positions once traders no longer have enough collateral to keep them open. As ETH moved through $2,600, additional positions were pushed through their liquidation levels.
Rising Yields and Oil Add Pressure on Ethereum
Ethereum’s fall is also occurring during a broader risk-off move across global markets rather than an isolated ETH selloff.
Brent crude climbed above $101 a barrel on Wednesday, while the benchmark 10-year U.S. Treasury yield moved to about 5.33%. The 30-year Treasury yield reached roughly 5.71%, around its highest level in 24 years.
The U.S. dollar strengthened at the same time, with the Dollar Index rising 0.64% to 102.49. Ether was already down about 4.5% when the dollar move was reported and subsequently extended the decline toward $2,550.
Higher bond yields raise the return available on relatively lower-risk assets, while a stronger dollar can tighten financial conditions for dollar-priced risk assets including cryptocurrencies.
Bitcoin, XRP and crypto-linked stocks also fell Wednesday as the same combination of rising oil prices, bond yields and the dollar weighed on markets.
Ethereum ETF Outflows Add to Selling Pressure
The selloff comes after another deterioration in demand for U.S. spot Ethereum exchange-traded funds.
The funds recorded approximately $201.9 million in net outflows on October 6, their largest single-day withdrawal in about three weeks, according to SoSoValue data. It was the sixth consecutive session of net outflows, taking withdrawals since September 29 to roughly $407.8 million.
That removes one source of spot-market demand just as leveraged positioning is being unwound.
Ethereum had held close to $2,700 through much of the ETF outflow streak. Wednesday’s move is the first significant break below that range.
Ethereum Tests Its 50-Day Moving Average
The daily chart has now brought ETH directly into an important technical area.
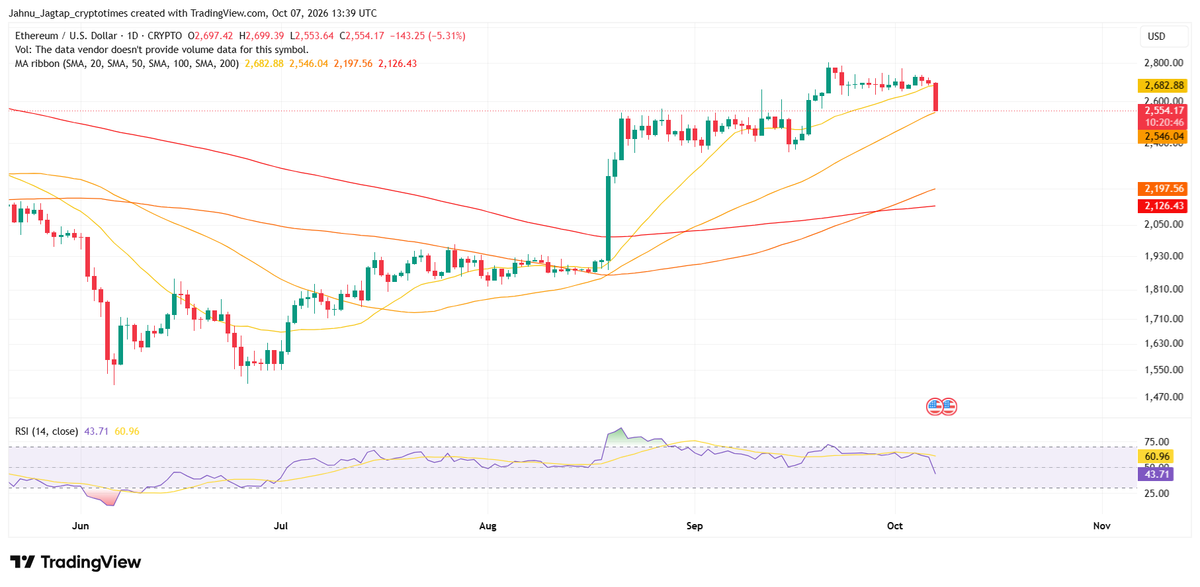
Ethereum’s 50-day simple moving average stood at approximately $2,546.04 when ETH was trading near $2,554. That leaves less than $10 between the market price and the moving average.
The 50-day exponential moving average sits lower, near $2,502.45, putting the $2,500 area immediately behind the current support zone if selling continues.
Shorter-term averages have already moved above the price. TradingView showed the 30-day exponential moving average near $2,602.67 and the 30-day simple moving average at $2,611.56. The 20-day exponential and simple averages were around $2,646.30 and $2,683.19, respectively.
That leaves roughly 2,600-2,683 as the first major area ETH would need to reclaim to reverse Wednesday’s short-term deterioration.
Longer-term averages remain well below the current market. The 100-day simple moving average was near $2,197.62 and the 200-day simple moving average near $2,126.46.
Momentum Turns Lower, but ETH Is Not Oversold
Ethereum’s daily Relative Strength Index was around 44, below the neutral midpoint of 50 but still above the conventional oversold level of 30.
TradingView’s oscillator readings also showed Momentum and the Moving Average Convergence Divergence indicator on Sell, while most other oscillators, including RSI and Stochastic RSI, remained Neutral.
The combination points to weakening short-term momentum without showing the kind of deeply oversold reading that usually accompanies an exhausted selloff.
The broader setup has changed quickly from the beginning of October. A Crypto Times analysis published October 3 had identified the 2,650-2,600 zone as an important test for Ethereum after its September rally. ETH has now broken through that range and reached the 50-day average.
Fed Minutes Are the Next Macro Test
Markets are now waiting for minutes from the Federal Reserve’s September 15-16 policy meeting.
The Federal Reserve calendar schedules the release for 2:00 p.m. ET, or 18:00 UTC, on October 7.
At the September meeting, the Fed raised the federal funds target range by 25 basis points to 3.75%-4.00%. Federal Reserve Investors will be looking for details on how officials assessed inflation and whether additional rate increases could follow.
For Ethereum, the immediate price battle has moved to the 2,546-2,500 area. A recovery would first have to take ETH back through roughly $2,600 before the heavier cluster of short-term moving averages between $2,646 and $2,683 comes back into range.