
Key Highlights
- Bitcoin fell to about $83,280 at 13:37 UTC on October 7, down 3.5% in 24 hours after trading as high as $86,648.
- BTC liquidations reached $166.81 million over 24 hours, including $156.69 million in longs, or nearly 94% of the total.
- Bitcoin lost its 20-day moving average near $84,182, putting the $83,000 area and the 50-day average near $80,278 in focus if selling continues.
Bitcoin fell below $84,000 on Wednesday as a sharp sell-off accelerated across the crypto market, wiping out leveraged bullish positions and sending BTC toward its lowest level in more than a week.
Bitcoin was trading at $83,280.52 at around 13:37 UTC on October 7, according to CoinGecko, down 3.5% over the previous 24 hours. BTC traded between $86,648.14 and $83,273.19 during the period, meaning nearly $3,400 separated the session high and low.
The move deepened an earlier decline that had already pushed Bitcoin below $85,000. The Crypto Times reported earlier Wednesday that BTC was struggling to recover after another rejection close to $87,000. The latest selling has since pushed the price another leg lower.
Bitcoin Drops to $83,280 as Selling Accelerates
Bitcoin’s decline gathered pace after buyers again failed to establish a breakout above the $86,500 to $87,000 region.
CoinGecko data at 13:37 UTC showed BTC’s market capitalization falling to about $1.674 trillion, while 24-hour trading volume had climbed to $37.33 billion. The increase in volume alongside falling prices points to heavier trading activity as sellers took control of the session.
Bitcoin had traded above $86,500 during the previous 24 hours before sliding toward $85,500 and then breaking sharply lower. The decline briefly took BTC close to $83,200 before buyers slowed the move.
The sell-off also came almost exactly one year after Bitcoin reached its record high of $126,080 on October 6, 2025. At current levels, BTC remains roughly one-third below that peak.
$156.7 Million in Bitcoin Longs Liquidated
Leverage magnified Wednesday’s decline with over 94% longs liquidated in a short period of time. Bitcoin-specific liquidation data at around 13:41 UTC showed $166.81 million in BTC positions liquidated over the previous 24 hours.
Long positions accounted for $156.69 million of those liquidations, compared with only $10.11 million in shorts. Longs therefore represented 93.94% of all Bitcoin liquidations during the period.
The imbalance became even more pronounced during the sharpest portion of the sell-off. Over 12 hours, Bitcoin liquidations totaled $150.22 million, including $143.76 million in longs and $6.46 million in shorts.
Four-hour liquidations stood at $28.91 million, of which $25.71 million came from long positions. During the latest one-hour period, another $12.49 million was wiped out, including $12.26 million in longs.
The data showed 8,409 traders liquidated as Bitcoin volatility exceeded 4.2%.
The largest individual BTC liquidation was worth about $11.75 million, while the most intense liquidation period occurred between 07:30 and 08:30 UTC on October 7.
That sequence shows how the initial spot-price decline developed into forced selling. Once Bitcoin fell through levels where leveraged traders could no longer maintain their positions, exchanges automatically closed those trades, creating additional sell pressure.
Binance Accounts for Half of BTC Liquidations
The liquidation wave was spread across major derivatives exchanges, although Binance carried the largest share.
Binance recorded approximately $84.49 million in Bitcoin liquidations over 24 hours, representing 50.65% of the BTC total. Of that amount, about $81.89 million came from longs and $2.61 million from shorts.
Hyperliquid followed with $35.48 million in BTC liquidations, including $32.94 million in longs. Bybit recorded another $18.62 million, with $17.56 million coming from bullish positions.
The concentration of losses among long traders shows that the market entered Wednesday’s decline positioned heavily for further upside after Bitcoin’s repeated attempts to break through $87,000.
Once that breakout failed, the same leverage that could have accelerated an upside move instead amplified the fall.
Oil and Treasury Yields Add Pressure to Bitcoin
Bitcoin’s fall was also part of a broader move away from risk as energy prices and U.S. borrowing costs climbed.
Brent crude approached $102 per barrel during Wednesday’s session, while the 10-year U.S. Treasury yield moved to around 5.33%.
Higher oil prices are particularly important for markets because sustained increases can feed inflation concerns. At the same time, rising Treasury yields make interest-bearing government debt more attractive relative to assets such as Bitcoin that do not generate a yield.
The U.S. Dollar Index also climbed toward 102.28, its strongest level since April 2025, adding another source of pressure on crypto and other risk-sensitive assets.
The combination hit assets beyond Bitcoin. Ethereum fell around 4% toward $2,600 during the session, while XRP lost more than 3%. Coinbase and Robinhood shares were also lower as the crypto sell-off moved into U.S.-listed companies with direct exposure to digital asset activity.
Bitcoin Breaks Below Its 20-Day Moving Average
The sell-off has also changed Bitcoin’s short-term technical picture.
At 13:36 UTC, TradingView showed BTC trading around $83,381 after reaching an intraday low of $83,244.
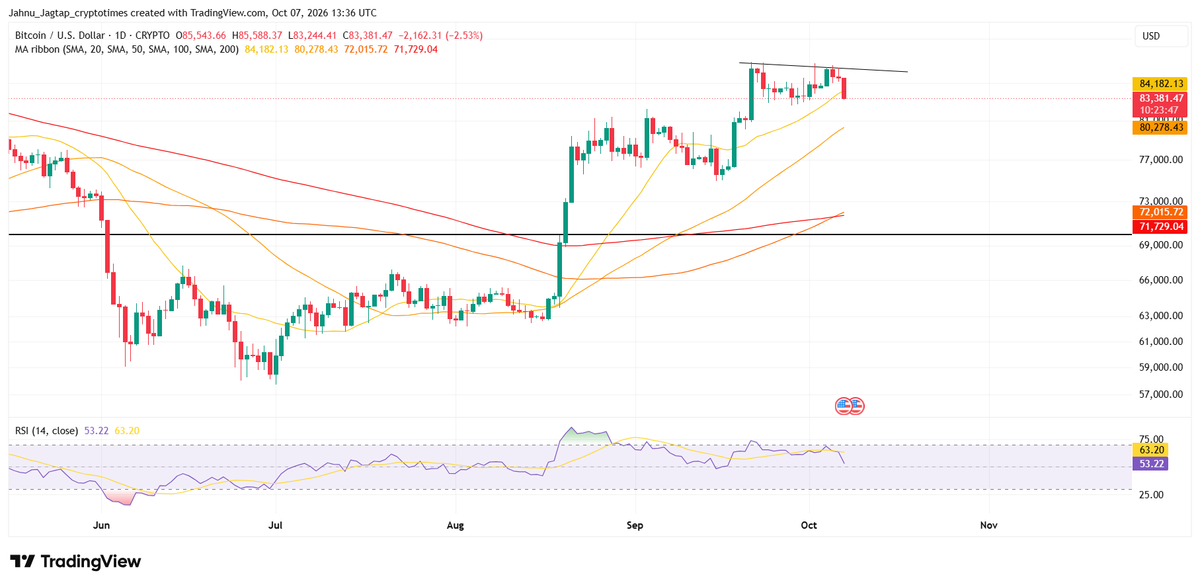
Bitcoin’s 20-day simple moving average stood at approximately $84,182. BTC’s fall below that level means an average that had supported the recent advance is now sitting above the market.
The 50-day moving average was considerably lower at $80,278. The 100-day and 200-day averages remained near $72,016 and $71,729, respectively.
That leaves Bitcoin’s broader trend substantially stronger than its short-term price action, but the immediate structure has weakened. BTC now has to recover above the 20-day average to undo some of Wednesday’s technical damage.
Momentum weakened at the same time. Bitcoin’s 14-day Relative Strength Index fell to 53.22 at 13:36 UTC, compared with its RSI moving average near 63.20.
An RSI above 50 still leaves momentum marginally on the positive side, but the rapid decline from stronger readings shows that buying pressure has faded. The indicator also remains well above the conventional oversold threshold of 30, leaving room for further downside without the market becoming technically oversold.
Bitcoin ETF Demand Had Already Started Weakening
The sell-off follows another reversal in U.S. spot Bitcoin ETF flows.
Spot Bitcoin ETFs recorded roughly $89.9 million in net outflows on October 5 after attracting about $293 million across the previous two trading sessions, according to SoSoValue data. The reversal matters because Bitcoin’s recent pushes toward $87,000 have repeatedly failed to develop into sustained breakouts. Stronger spot demand could help absorb selling in derivatives markets, while weaker ETF demand leaves leveraged futures activity carrying more of the move.
Bitcoin perpetual futures open interest was still about $68.63 billion at 13:37 UTC, according to CoinGecko data.
Large open interest does not itself indicate whether traders are bullish or bearish, but it means substantial leveraged exposure remains active. Sharp moves through heavily positioned price levels can therefore continue to produce forced liquidations.
Fed Minutes Become the Next Test for Bitcoin
The Federal Reserve is now the next major scheduled event for markets.
Minutes from the Fed’s September meeting are due at 18:00 UTC on October 7. Investors will be looking for evidence of how policymakers view inflation and whether support remains for another interest-rate increase before the end of the year.
The Fed raised its benchmark rate by 25 basis points at its September meeting, bringing the target range to 3.75% to 4.00%.
Expectations for another immediate increase have fallen following weaker U.S. employment data, but the rise in oil prices complicates the inflation picture. Treasury yields have continued to rise even as expectations for an October hike weakened.
For Bitcoin, that leaves the market caught between softer expectations for near-term Fed tightening and financial conditions that remain restrictive because of high bond yields and a stronger dollar.
Can Bitcoin Hold $83,000?
Bitcoin is now trading immediately above one of the most important short-term areas on its chart.
The $83,000 region has repeatedly attracted buyers during the recent trading range. Wednesday’s low near $83,244 puts BTC close to testing that area again.
A sustained break below $83,000 would leave relatively little technical support before the 50-day moving average near $80,278. The psychological $80,000 level would therefore become increasingly important if the current decline extends.
On the upside, Bitcoin first needs to reclaim its 20-day moving average around $84,182. Above that, the $85,500 region and the repeated resistance between roughly $86,500 and $87,000 remain the main barriers.
For now, the market has moved from repeated attempts to break $87,000 into a test of whether buyers can defend $83,000. With almost 94% of Bitcoin’s latest liquidations coming from longs and the Fed minutes still ahead, leverage and macro conditions remain capable of producing another sharp move before the session ends.