Cardano (ADA), the native token of the Cardano blockchain, was the strongest performer among major cryptocurrencies on October 5, 2026. ADA climbed 11% in 24 hours to trade at $0.2722 at press time, after moving between a low of $0.2442 and a high of $0.2749 during the session.
The move took the token to its highest level in roughly three months and came on more than $1 billion in daily trading volume.
ADA Price Today: Key Market Data
According to CoinGecko market data, ADA’s market capitalization, the total value of all tokens currently in circulation, stood at $10.222 billion, keeping Cardano at rank 15 among all crypto assets. Its fully diluted valuation (FDV), which measures the value of the entire maximum supply at the current price, was $12.253 billion.
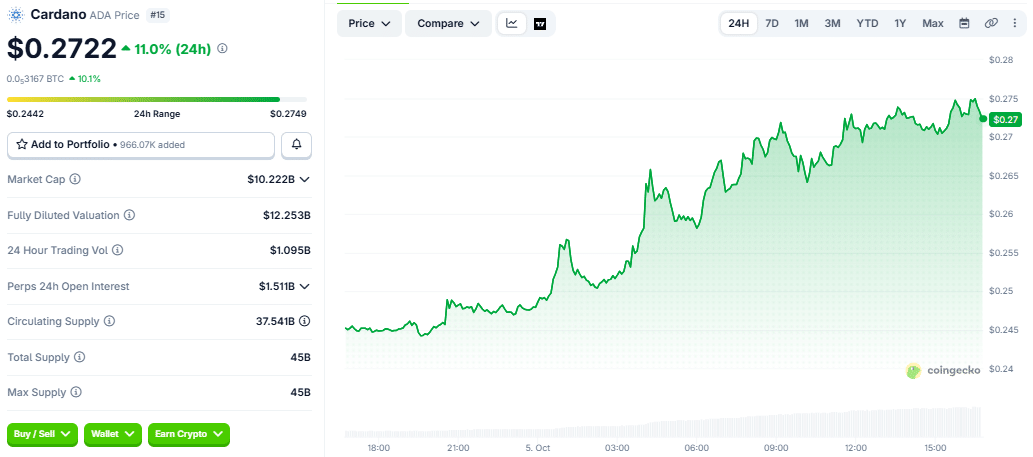
Cardano has a circulating supply of 37.541 billion ADA out of a fixed maximum supply of 45 billion, meaning about 83.4% of all tokens that will ever exist are already in circulation.
Spot trading volume over 24 hours reached $1.095 billion, equal to about 10.7% of ADA’s market capitalization. Open interest on perpetual futures, which tracks the total value of outstanding derivatives contracts that have no expiry date, stood at $1.511 billion on the same page.
The rally was largely specific to Cardano. ADA also gained 10.1% against Bitcoin over the same period, a sign that the token outperformed the wider market rather than simply following it. Bitcoin (BTC) traded near $86,000 with a gain of about 1%, while Ethereum (ETH), the native token of the Ethereum network, rose roughly 0.5%.
Despite the gain, ADA remains roughly 91% below its all-time high of $3.09, recorded in September 2021.
Cardano Golden Cross Adds Technical Support
The price move follows a notable technical signal on ADA’s daily chart. A golden cross forms when a shorter-term moving average (MA), which smooths price data over a set period, rises above a longer-term one. Traders usually watch the 50-day MA crossing above the 200-day MA as a sign that a longer trend may be turning upward.
ADA’s 50-day simple moving average crossed above its 200-day average on the daily chart around October 3, based on TradingView chart data. It was the first such signal on the daily timeframe since August 2025.
The signal is not uniform across all chart settings. Versions that use exponential moving averages (EMA), which give more weight to recent prices, had not confirmed the cross in early October.
History also shows the limits of the pattern. After the August 2025 golden cross, ADA briefly rose to about $0.92, but the trend did not hold. A death cross, the opposite signal in which the 50-day MA falls below the 200-day MA, appeared in November 2025, and the price declined in the months that followed. Because moving averages are built from past prices, a golden cross describes a trend that is already underway rather than predicting what comes next.
What Is Behind the Cardano Rally?
No single announcement explains the session’s gain, but several developments in the Cardano ecosystem over the past week have kept the token in focus.
The most recent is RealFi, a decentralized finance (DeFi) protocol that went live on Cardano’s mainnet on October 1, 2026. DeFi refers to financial services such as lending and trading that run on blockchains without traditional intermediaries. RealFi issues a dollar-pegged stablecoin backed by real-world assets (RWA), including traditional financial instruments such as Treasuries and private credit, as well as a yield-bearing staked version. The platform advertises yields of up to 9% a year and launched with integrations including the Lace wallet, the Liqwid lending protocol and the SundaeSwap decentralized exchange.
Cardano Founder Charles Hoskinson has personally invested several million dollars in RealFi, according to 24/7 Wall St. The same report notes that the platform blocks users in the United States, the European Union, and the United Kingdom, and that Cardano currently holds only about $70 million in stablecoins. Because RealFi deposits and returns are denominated in dollars, its direct demand for ADA may be limited mainly to network fees.
A second development came on September 30, when the Cardano Foundation announced two blockchain applications built with Petrobras, Brazil’s state-controlled energy company, and the Ledger Labs blockchain center at the Pontifical Catholic University of Rio de Janeiro (PUC-Rio). One application tracks environmental claims tied to sustainable aviation fuel (SAF), a lower-carbon alternative to conventional jet fuel, while the other records data for Diesel R, Petrobras’ renewable diesel brand. The projects remain at the research and development stage, and no timeline for wider commercial use has been disclosed, as The Crypto Times reported in its coverage of the Petrobras pilots.
Today’s move also extends a recovery that has been building for several weeks. ADA rose 26% in a single week in late September to reclaim $0.25, after rebounding from below $0.18 in early August.
Key ADA Price Levels to Watch
On the upside, the session high of $0.2749 and the round-number zone near $0.28 form the first area of resistance, a price level where selling has previously slowed gains. A sustained move above that range would bring $0.30 into view, followed by the August high near $0.31, a level analysts flagged in The Crypto Times’ September analysis.
On the downside, $0.26 is the nearest support, the level where buyers have previously stepped in, followed by $0.25. A daily close back below $0.25 would erase most of the breakout and put the session’s starting area near $0.2442 back in focus.
The size of the move also raises the risk of a short-term pullback. ADA climbed about 12.6% from its session low to its session high, and sharp single-day rallies of this kind often see part of the gain retraced as traders take profits.
What Could Change the Outlook
Two sets of data are likely to shape ADA’s next move. The first is derivatives positioning. If perpetual futures open interest continues to rise above the current $1.511 billion while the price holds above $0.27, it would suggest new positions are backing the rally. Falling open interest alongside a stalling price would instead point to short sellers closing their bets, a move that tends to fade once that buying ends.
The second is on-chain activity. Growth in Cardano’s total value locked (TVL), the amount of capital deposited in its DeFi applications as tracked by DeFiLlama, along with rising stablecoin balances and RealFi deposits, would indicate whether new products are attracting real usage. Until those figures move, the rally rests mainly on market positioning and technical signals rather than a measurable rise in network demand.
Also Read: Ethereum Price Holds $2,700 Despite $155M ETF Outflows in 4 Days, Glamsterdam Testnet