Bitcoin traded near $78,891 as of early Wednesday, remaining within a short distance of the $79,000 level after August’s rally. The modest advance comes as on-chain metrics point to a healthier market structure, even as genuine spot demand has yet to take the lead, according to a CryptoQuant analysis.
As of 6:30 AM UTC, September 9, Bitcoin was trading near $78,851, up decently 0.56% over the prior 24 hours. The 24-hour range stretched from $77,636 to $79,353, with a market capitalization of $1.58 trillion and 24-hour trading volume of $32.47 billion—as per live market data from CoinGecko.
The modest overnight gain amid on-chain metrics showing an improving market structure even while genuine spot buying has yet to take the lead. A CryptoQuant Quicktake published by analyst XWIN Japan argues that Bitcoin’s underlying setup is constructive, yet the next decisive move still hinges on whether spot demand can absorb available supply.
Price Stabilizes After Recent Volatility
Bitcoin spent early September oscillating between the mid-$77,000s and low $82,000s—as shown in TradingView’s year-to-date (YTD) chart. After a sharp rally on September 3 that pushed prices above $81,000, the market pulled back and has since consolidated in a tighter band. The latest session’s modest advance kept price above recent session lows but failed to recapture the $80,000 handle that briefly appeared last week.
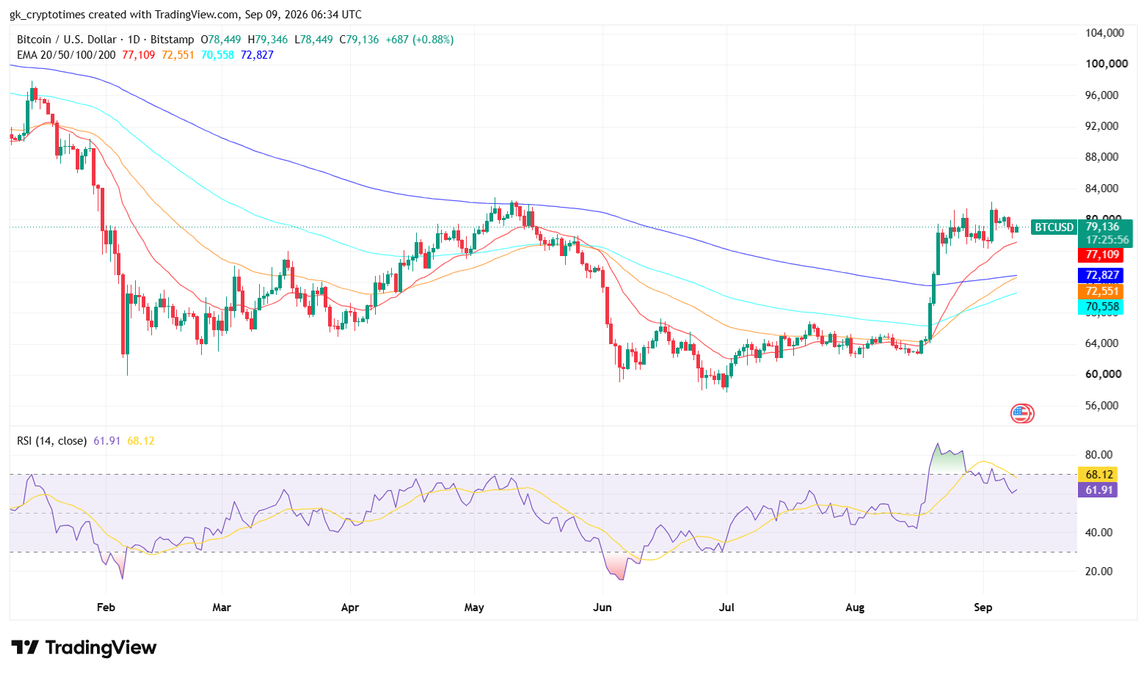
Market capitalization near $1.58 trillion places Bitcoin still far ahead of other digital assets, yet year-to-date performance remains negative. The current level sits roughly 29% below prices recorded one year earlier. Volume of $32.47 billion indicates active but not extraordinary participation compared with peaks seen during stronger trend days earlier in the cycle.
These price readings provide the backdrop for the on-chain picture. Traders watching only the ticker see a market that has stopped falling but has not yet produced a convincing breakout. The CryptoQuant analysis supplies the structural context behind that stalemate.
On-Chain Indicators Point to Healthier Foundations
According to the analysis, several longer-term metrics have improved. ETF holdings continue to rise—reaching as high as $103.34 billion, as per SoSoValue data—indicating that institutional investors are steadily absorbing Bitcoin. Large holders have also been active on the bid, with a notable buy wall forming around current price levels.
Derivatives positioning has undergone a partial reset. Coinglass data shows funding rates turned negative and open interest declined from about $27.5 billion to $25.7 billion between September 4 and 5. That reduction in leverage reduces the immediate risk of cascading liquidations. At the same time, Binance Bitcoin open interest recently climbed above $10 billion, a six-month high, showing that futures activity remains elevated.
Short-term holder SOPR has moved back above 1. That reading signals that recent buyers are, on average, in profit again—an improvement in sentiment. However, it also creates room for profit-taking if price stalls. Older coins, including some linked to 2010-era miners, have become more active, adding another layer of potential supply that must be absorbed.
Exchange-side data is mixed. Binance Bitcoin reserves remain elevated at roughly 685,000–690,000 BTC. The seven-day average of exchange net inflows has risen to about +593 BTC. Simultaneously, stablecoin inflows are increasing. The combination means both potential sell-side supply and fresh purchasing power are growing at the same time.
Taken together, these readings describe a market that has cleaned up some of the excess leverage that characterized earlier periods and that continues to see patient capital accumulate. The structure is no longer as fragile as it appeared during sharper drawdowns earlier in 2026.
Spot Demand Has Yet to Confirm the Shift
The central caveat in the CryptoQuant piece is that the recovery is not yet fully spot-led. Elevated futures open interest on Binance, high exchange reserves, and only modest net inflows suggest that derivatives positioning and latent supply still play a large role.
Spot demand—the actual purchase of Bitcoin for ownership rather than leveraged bets—has lagged the improvement in other metrics. Without a clear expansion in spot buying, available supply from exchanges and older holders can cap upside. The analyst notes that both potential selling pressure and buying power are rising in tandem, leaving the balance unresolved.
This distinction matters because durable advances in prior cycles have typically been accompanied by visible spot absorption that reduces exchange balances over time. The current data set shows institutional and large-holder accumulation occurring, yet not at a pace that has produced a decisive decline in readily available coins.
Bitcoin’s price near $78,900 therefore reflects a market in transition rather than one that has already confirmed a new directional trend. The on-chain structure has improved, leverage has been reduced in parts of the derivatives market, and longer-term holders continue to participate. What remains missing is the broader spot demand that would absorb the coins sitting on exchanges and those becoming active after long dormancy.
Market participants will watch whether exchange netflows turn more consistently negative, whether Binance reserves begin to decline, and whether spot volumes expand relative to perpetual futures. Until those confirmations appear, the constructive structure described by CryptoQuant coexists with a still-lagging demand picture. Price action in the high $70,000s captures that tension: stable enough to hold recent lows, not yet strong enough to force a clean breakout.
Also read: Ethereum Price Prediction September 2026: Can ETH Reach $2,800?