Bitcoin traded near $79,400 on Monday (12:30 PM UTC), September 7, 2026, after failing to hold a weekend push toward $80,500. Traders are watching these levels closely as the largest cryptocurrency enters the week.
Live market data from TradingView shows that BTC was trading at $79,493 after price failed to hold above the $80,400 area. It builds on the late-August vertical rally that lifted BTC through a stack of rising EMAs, 20-day at $76,770, 200-day at $72,710, 50-day at $72,046 and 100-day at $70,230, with the medium-term trend has flipped from a grinding decline into a short-term uptrend, but the latest candles are now compressing just below the May swing highs near $82,000–$83,000 rather than extending.
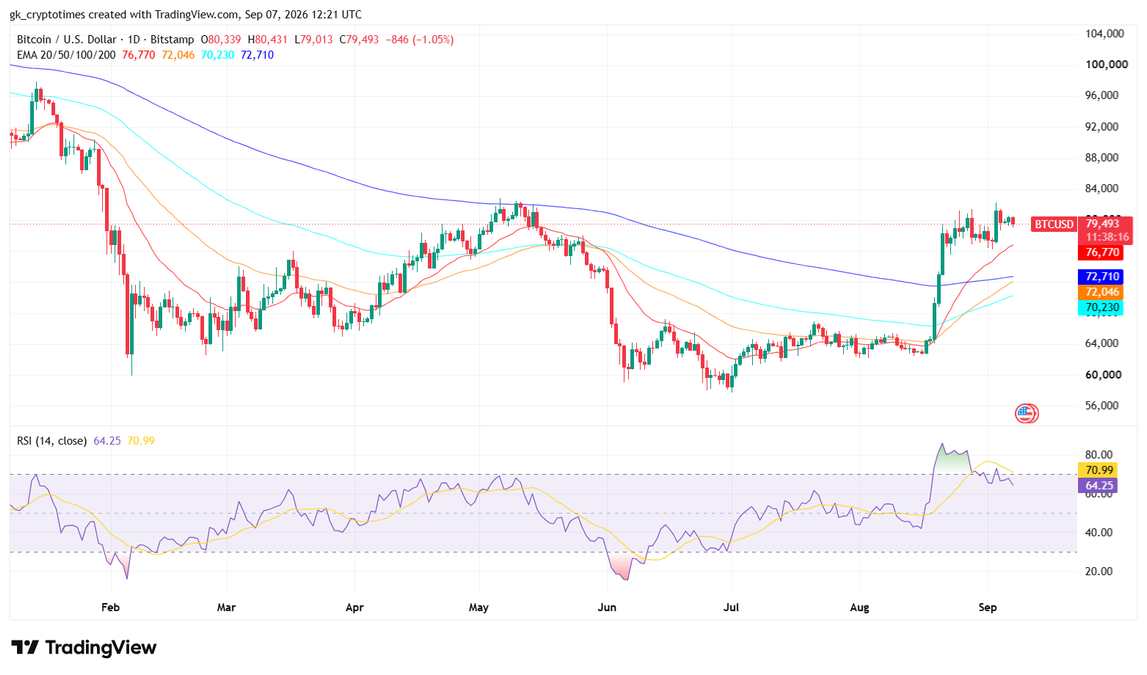
RSI (14) has cooled from an overbought spike above 80 to 64.25, with its signal line at 70.99, which reads as momentum fading after the squeeze, not a fresh breakdown.
CoinGlass derivatives data showed a market still leveraged but not in a cascade. Site-wide futures open interest stood near $140.1 billion, off 0.4%, while 24-hour futures volume was about $143.0 billion, up 29.4%. The 24 hours liquidation totaled about $199 million, with the 24-hour long/short split at 48.27% long and 51.73% short.
On Bitcoin specifically, CoinGlass counted 1,945 long liquidations against 1,360 short liquidations over 24 hours. The last four hours were more one-sided: 961 long liquidations versus 181 short liquidations, consistent with the $80,500 rejection. The four-hour exchange long/short ratio showed 45.79% long and 54.21% short, or about $3.20 billion in longs against $3.79 billion in shorts.
CoinGlass liquidation-map intensity also clustered away from spot: a drop through $76,211 implied about $1.04 billion in long liquidation intensity on major exchanges, while a break through $83,521 implied about $1.00 billion in short intensity.
These moves left the market split between two readings: a short-term higher-low setup that could still reach $83,000 to $84,000, and a longer cycle argument that the decline from the October 2025 peak has not finished on time or on price.
Weekend Pump Meets Monday Rejection
Intraday structure, not headlines, drove Monday’s tape. On Sunday, analyst on X Kaz (@XBTkaz) had flagged a possible “Sunday scam pump” into rejection at $80,500 and $80,800, with a preferred long only after a return to his “mO” level near $78,500. By Monday’s Asia open, that sequence had printed: price tagged the $80,500 area and turned down.
Kaz then updated the map. The next area of interest, he wrote, was a continuation lower into $78,500 “or the zone below it,” where he would look for longs toward $83,000 to $84,000. He described the path as still “playing out.” That is a tactical claim, not a cycle call. It says Bitcoin can fall first and still be bought if $78,500 holds as demand.
According to the analyst, a hold and bounce from $78,500 keeps the $83,000–$84,000 test alive. A clean break under that pocket would weaken the higher-low case. CoinGlass’s heavier long liquidations in the latest four-hour window fit the rejection, not a finished squeeze.
Read: ZEC Price Prediction for September: Will It Cross $2,200?
Cycle Time Still Short of Prior Bottoms
The more cautious argument is about duration. Gerla, another renowned analyst with substantial following on X, said he is “still not convinced $BTC has bottomed.” In his telling, the last two correction cycles took roughly 364 days to complete. He put the current decline at about 329 days from the 2025 peak and said price has not yet reached the lower band where those earlier bottoms formed.
That framing treats the latest rebound as a possible bullish trap: an expansion that shakes out late buyers before one more leg down. Gerla said he wants the lower band tested and the remaining days in that 364-day window to play out before calling a low.
A reply in the same thread widened the clock. Using prior all-time-high-to-low counts of 363, 376 and 410 days, the commenter placed the market at 336 days from the October 6, 2025 peak and mapped analogous dates to October 4, October 17, and November 20, 2026. Those dates are historical analogies, not timers. They explain why some traders refuse to treat a $79,000 handle as finished business.
Weekly Signals Conflict at the 50-Week Average
Weekly indicators are mixed, which is why the $79,400 area matters. Ted (@TedPillows) wrote that Bitcoin “failed to close above” the 50-week moving average. His chart placed that average near $79,725.33, with a weekly print around $79,775. Bitcoin is pressing the line and has not secured it.
Ted also said the weekly Supertrend had turned green for the first time since January 2023. That is an early regime signal, not proof of a low. His published confirmation line was a reclaim of the 50-week average and a break “above $830,000.” The accompanying chart and the $83,000–$84,000 targets used by other traders in the same session indicate the operative breakout level under discussion is $83,000. Until Bitcoin reclaims the 50-week average and clears that shelf, the weekly evidence remains incomplete.
Below the 50-week average, Monday’s market is a failed breakout plus a Supertrend change. Above $83,000, the same market becomes a confirmed weekly turn. CoinGlass’s $83,521 short-liquidation cluster sits just above that same breakout zone.
Flows Shift While Bitcoin Still Leads the Tape
Even as Bitcoin chops under $80,500, positioning arguments have moved past the single-asset chart. Lucky (@LLuciano_BTC) said a rotation he had outlined earlier was starting to appear. In his update, “$OTHERS has flipped $BTC in open interest dominance,” meaning derivatives activity was spreading beyond Bitcoin. He expects “the next 3 months” to favor mid and lower-cap tokens if that rotation holds.
That claim does not require a final Bitcoin bottom. It only requires Bitcoin to stop absorbing all of the bid. A range between $78,500 and $84,000 would be enough, on this reading, for risk to leak down the market-cap stack.
A separate claim came from Cup (@cryptocupra), who argued that Strategy ($MSTR) was reprinting a structure that previously preceded a large advance. His point was sequential: if Bitcoin makes its next major leg, MSTR becomes the leveraged equity expression of that move. It pays only if Bitcoin gets the $83,000 confirmation the weekly camp is waiting for.
Monday’s Bitcoin price is not a verdict. It is a location. Price is below $80,500 rejection, above $78,500 demand, and pinned to a 50-week average it has not reclaimed. CoinGlass shows leverage still present, shorts slightly larger on the four-hour ratio, and long liquidations rising after the failed push — not a market that has already chosen a side.
Also read: Capital B Buys 376 BTC While Treasury Sits $80 Million Underwater