
XRP is holding above its 200-day simple moving average after recovering sharply from its August lows, keeping the broader rebound intact as the cryptocurrency attempts to extend its move toward higher resistance levels.
According to TradingView’s XRP/USDT chart, XRP traded at $1.3665 as of 09:34 UTC on September 3, gaining 1.14% for the day. The token had moved between an intraday low of $1.3401 and a high of $1.3795, with trading volume at about 55.16 million XRP at the time of the chart snapshot.
The latest structure follows a sharp recovery during August. XRP had been testing the psychologically important $1 level earlier in the month before momentum reversed. The Crypto Times previously reported that XRP was testing $1 support on August 11, before the token later surged about 18% during the broader crypto rebound.
XRP Holds Above 200-Day Moving Average
On the daily chart, XRP is now trading above its 200-day simple moving average at $1.2748, putting the price back above a long-term trend level after the weakness seen earlier in August.
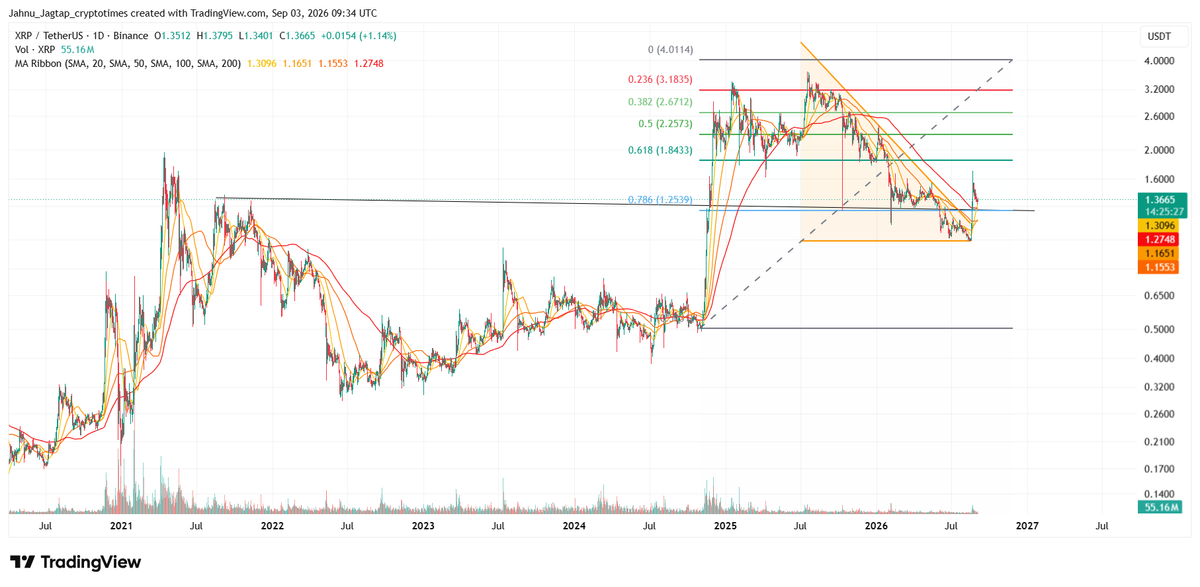
The token is also holding above its 20-day Simple Moving Average (SMA) at $1.3096, while the 200-day exponential moving average sits closer to the current market at $1.3514. With XRP trading around $1.37, these averages form the first layer of support underneath the latest rebound.
The short-term picture, however, still has resistance immediately above the current price. The 10-day SMA stands at $1.3896, slightly above XRP’s September 3 intraday high of $1.3795. That leaves the $1.38–$1.39 area as the first level the price needs to overcome before the recovery can begin testing higher resistance.
The structure marks a significant improvement from late July, when XRP entered August near $1.05 and remained below several important resistance levels. At the time, The Crypto Times’ August XRP technical outlook identified $1.22 and $1.38 as important levels for determining whether the recovery could extend.
XRP subsequently moved above those earlier levels and reached around $1.50 later in August. The Crypto Times reported on August 24 that XRP was trading near $1.50 after rebounding from below $1 earlier in the month.
Can XRP Price Extend Toward $1.84?
The wider daily structure places the 0.618 Fibonacci retracement at $1.8433, making it the next major Fibonacci resistance if XRP can sustain the recovery. Fibonacci retracement is a technical analysis tool that uses Fibonacci levels to identify potential support and resistance zones during a price pullback, while Fibonacci resistance highlights potential price ceilings where an asset’s upward movement may slow, stall, or reverse.
The level is derived from the broader price move shown on the daily chart, with the Fibonacci structure extending from XRP’s lower range toward its previous high around $4.0114. The 0.786 retracement lies at $1.2539, while the 0.618 level sits considerably higher at $1.8433.
XRP is not yet directly testing $1.84. The price first needs to clear the resistance around its 10-day moving average near $1.39 and sustain the move above the price region that capped its rebound during August.
A break above those intermediate levels would strengthen the recovery structure and bring $1.8433 more clearly into focus. The level is technically significant because it represents the next major Fibonacci resistance above the current trading range rather than an arbitrary price target.
If XRP eventually moves through $1.8433 and holds above it, the chart places the 0.5 Fibonacci retracement at $2.2573 as the next major resistance. Beyond that, the 0.382 retracement sits at approximately $2.6712.
For now, however, the $1.84 level remains dependent on XRP first confirming the breakout from its current range.
XRP Momentum Improves, but Indicators Remain Mixed
XRP’s momentum indicators have also strengthened alongside the recovery, although they are not giving a uniformly bullish reading.
According to TradingView’s XRP technical indicators, the 14-day Relative Strength Index stood at 59.96 at the time of the snapshot. The reading puts XRP above the neutral midpoint of 50 while remaining below the 70 level generally associated with overbought conditions.
The Average Directional Index stood at 42.07. The indicator measures the strength of a prevailing trend rather than its direction, with the elevated reading suggesting that XRP’s recent price movement has developed stronger trend characteristics.
The moving-average structure is comparatively stronger. XRP was above its 20-, 30-, 50-, 100-, and 200-day simple moving averages, although it remained below the 10-day SMA. Its 20-, 30-, 50-, 100-, and 200-day exponential moving averages were also below the market price at the time.
Oscillators provided a more mixed picture. Oscillators are technical indicators used to measure price momentum and identify potential overbought or oversold conditions. TradingView’s Momentum indicator, which measures the strength and speed of price movements, showed a buy reading, while MACD (Moving Average Convergence Divergence), an indicator used to identify trend direction and momentum, remained on a sell signal. The RSI (Relative Strength Index), Stochastic Oscillator, and Commodity Channel Index (CCI), which help assess momentum and potential price reversals, were neutral, suggesting that the improving price structure has not yet been confirmed by all momentum indicators.
What Could Weaken the XRP Recovery?
While $1.8433 represents the major higher resistance, XRP also has a relatively well-defined support region underneath the current price.
The first level sits around the 20-day SMA at $1.3096. Below that, the 200-day SMA at $1.2748 is positioned close to the 0.786 Fibonacci retracement at $1.2539, creating a broader support area between approximately $1.25 and $1.31.
Holding that zone would keep XRP above both its long-term moving average and the Fibonacci level that has recently been reclaimed, allowing the broader recovery structure to remain intact.
A sustained move below $1.25, on the other hand, would push XRP back beneath the 200-day SMA and the 0.786 Fibonacci retracement. Such a move would weaken the current setup and shift attention toward the lower moving-average cluster.
The 50-day SMA stands at $1.1651, while the 100-day SMA sits at $1.1553, placing another technical support area around $1.15–$1.17 if the current recovery loses momentum.
XRP has therefore regained several important technical levels after its August rebound, but the next stage still requires confirmation. Clearing the short-term resistance around $1.39 would strengthen the recovery, while holding above the $1.25–$1.31 support region would keep the $1.8433 Fibonacci resistance in focus.
Also Read: Bitcoin Cycle Momentum Turns Positive After Eight Bearish Months