Key Highlights
- XRP could remain between $1 and $1.22 during August, with the base-case month-end target placed between $1.08 and $1.20.
- CryptoQuant data shows improving long momentum on Binance, but the positive funding-rate Z-score remains close to neutral rather than signalling aggressive bullish positioning.
- A sustained breakout above $1.22 could open a move towards $1.25 and $1.38, while losing $1.01 could expose XRP to $0.95 or lower.
XRP is entering August at one of the most important points in its 2026 price structure.
The cryptocurrency traded near $1.05 on July 28 after falling more than 5% over 24 hours. XRP moved between an intraday high of approximately $1.11 and a low near $1.04, extending its seven-day decline to almost 8%.
The decline has brought XRP back towards the psychological $1 level, which buyers have defended repeatedly since late June. However, neither buyers nor sellers have established enough control to turn the current consolidation into a sustainable trend.
Based on the existing market structure, XRP will likely trade between $1 and $1.25 during August 2026, optimistic traders will be hoping for $1.50 however with a possible month-end price between $1.08 and $1.20.
A move beyond this range will depend on whether XRP can hold above $1.22 or loses support near $1.01.
XRP Price Remains Trapped Near $1
XRP has produced almost no net price progress over the past month.
CryptoRank data shows the token trading within a 30-day range of approximately $1.02 to $1.17, with its monthly return standing close to flat. The same data shows XRP down nearly 24% over three months and around 43% since the beginning of 2026.
This means XRP is not simply consolidating after a strong advance. It is attempting to establish support after a prolonged decline from levels above $2 earlier in the year.
The $1 area has nevertheless prevented a deeper correction so far. Each test of this zone has attracted buyers, but the rebounds have struggled to generate enough volume to break the resistance between $1.18 and $1.22.
The resulting structure has created a tightening range in which leveraged traders on both sides continue to get liquidated without producing a lasting directional move.
CryptoQuant Data Shows XRP Building a Volatility Coil
CryptoQuant described XRP’s latest market structure as a “volatility coil,” with both long and short positions suffering liquidations inside the same narrowing range.
The pattern suggests that XRP is storing volatility rather than developing a confirmed trend. Repeated liquidations remove leveraged positions from both sides, but they do not reveal whether the eventual expansion will move upwards or downwards.
This distinction matters because volatility compression is sometimes incorrectly interpreted as a bullish signal. In reality, the coil only suggests that the current low-volatility structure may not continue indefinitely.
A return of spot demand, a clear imbalance in liquidations or a break from the existing price range would be needed to establish direction.
The derivatives market already contains enough leverage to amplify that move.
CoinGlass reported approximately $2.45 billion in XRP open interest, compared with about $2.54 billion in 24-hour futures volume. Spot volume stood at roughly $382 million, while nearly $10.9 million in XRP positions had been liquidated over 24 hours.
Futures activity therefore remains significantly larger than spot activity. That imbalance increases the possibility that the initial breakout will be accelerated by liquidations rather than supported entirely by organic buying or selling.
XRP Long Momentum Improves, but Traders Are Not Overextended
A second CryptoQuant reading offers a slightly more constructive signal.
The XRP funding rate on Binance recovered to approximately 0.00138, while its 30-day Z-score moved back above zero to 0.21.
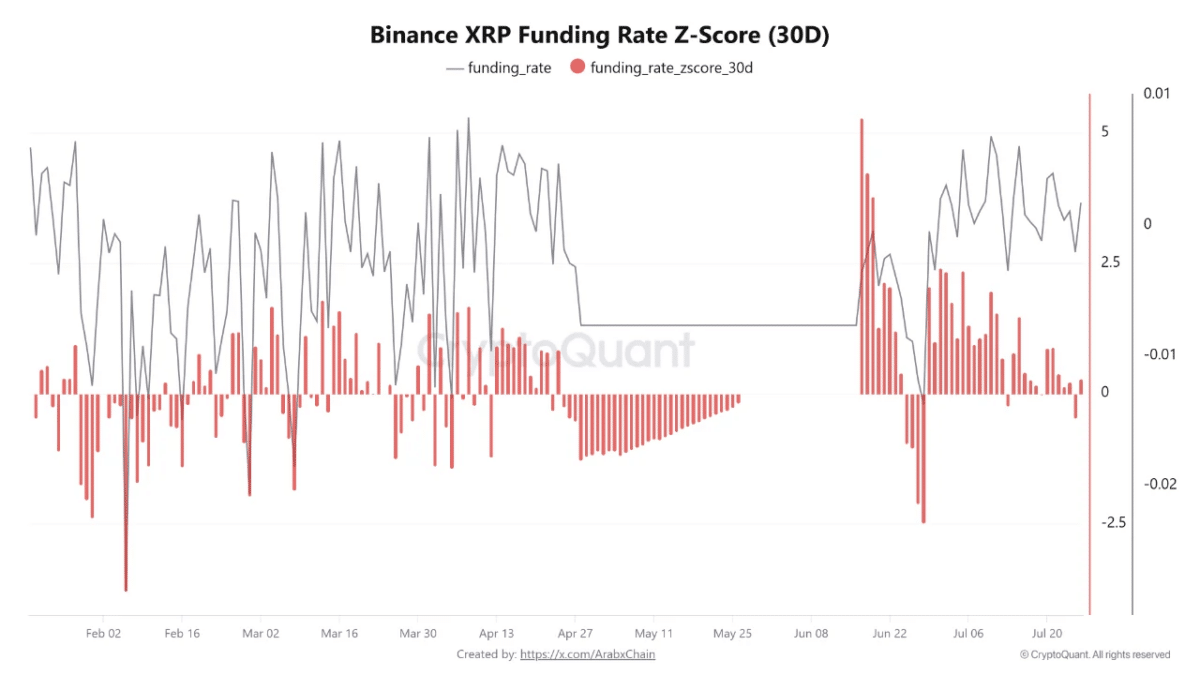
Positive funding means long-position holders are again paying shorts, indicating that derivatives positioning has shifted slightly towards buyers. The recovery follows a period when funding briefly turned negative as traders increased short exposure during XRP’s decline.
However, a Z-score of 0.21 remains close to its recent average. It does not show that XRP longs have become excessively crowded or that traders are placing unusually aggressive bullish bets.
The signal therefore points to improving sentiment, but not a confirmed price reversal.
For August, the ideal bullish setup would involve funding remaining moderately positive while XRP’s price and spot volume rise together.
A rapid increase in funding without corresponding spot demand would be less constructive. It could show that leveraged traders are chasing the move, leaving XRP vulnerable to another long liquidation event.
XRP Price Prediction for August 2026
| Scenario | Confirmation | August Price Outlook |
|---|---|---|
| Base case | XRP remains between $1.01 and $1.22 | $1.00–$1.22 range, with a possible close between $1.08 and $1.20 |
| Bullish case | Sustained daily closes above $1.22 with rising spot volume | $1.25 initially, followed by $1.38–$1.46 |
| Bearish case | Daily close below $1.01 followed by a failed recovery | $0.95 initially, with $0.85 possible during a broader sell-off |
| Highly bullish case | XRP reclaims $1.38 and ETF demand accelerates | Possible test of $1.46–$1.50 |
Base Case: XRP Trades Between $1 and $1.22
The most likely August outcome remains continued consolidation between $1 and $1.22.
XRP’s trend indicators were broadly neutral before the latest decline. The 14-day Relative Strength Index stood near 48.9, while the Average Directional Index was around 9.7. An ADX reading below 15 generally indicates that the market lacks a strong directional trend.
XRP’s present structure supports the same conclusion. Buyers have defended the $1 area, but price remains below major longer-term moving averages and has repeatedly failed to sustain moves above nearby resistance.
Under this scenario, XRP could recover towards $1.10 and $1.18 during August without completing a full bullish reversal.
A month-end close between $1.08 and $1.20 would keep the broader consolidation intact while allowing the derivatives market to gradually reduce excess leverage.
Bullish Case: XRP Breaks Above $1.22
The bullish scenario begins with XRP reclaiming $1.10 and $1.13 before challenging the resistance band between $1.18 and $1.22.
A single intraday move above $1.22 would not be sufficient. Buyers would need to produce sustained daily closes above the level, preferably accompanied by higher spot volume and continued ETF inflows.
If that happens, $1.25 becomes the first meaningful target. A rise from approximately $1.05 to $1.25 would represent a gain of about 19%.
The next resistance would sit near the longer-term moving-average region between $1.38 and $1.46. Technical data placed XRP’s 200-day simple moving average near $1.38, while a higher pivot resistance level stood near $1.46 before the latest decline.
Reaching $1.46 would require a gain of approximately 39% from the current price, meaning XRP would need more than a technical breakout. It would likely require improving crypto market liquidity, stronger ETF demand and a supportive macroeconomic environment.
Can XRP Reach $1.50 in August?
An XRP move to $1.50 remains possible, but it should be treated as a stretch scenario rather than the primary August prediction.
XRP would need to rise nearly 43% from approximately $1.05 to reach $1.50. It would also have to clear several resistance levels at $1.13, $1.22, $1.25 and the $1.38–$1.46 region.
The token has not demonstrated enough spot demand to justify treating that move as the base case.
A $1.50 target would become more credible only after XRP records sustained closes above $1.38 and shows that the move is being supported by spot purchases rather than predominantly leveraged futures positions.
Without those confirmations, traders risk buying into a temporary short squeeze that could reverse once liquidations have been completed.
Bearish Case: XRP Loses the $1 Support
The bearish scenario would begin with XRP falling below $1.01 and failing to quickly recover the level.
The first downside target would then sit near $0.95, representing a decline of roughly 9% from the current price. This zone could attract buyers looking for a recovery around a psychologically important discount below $1.
XRP’s daily chart shows price compressing between a descending resistance line and horizontal support around $1.02–$1.00.
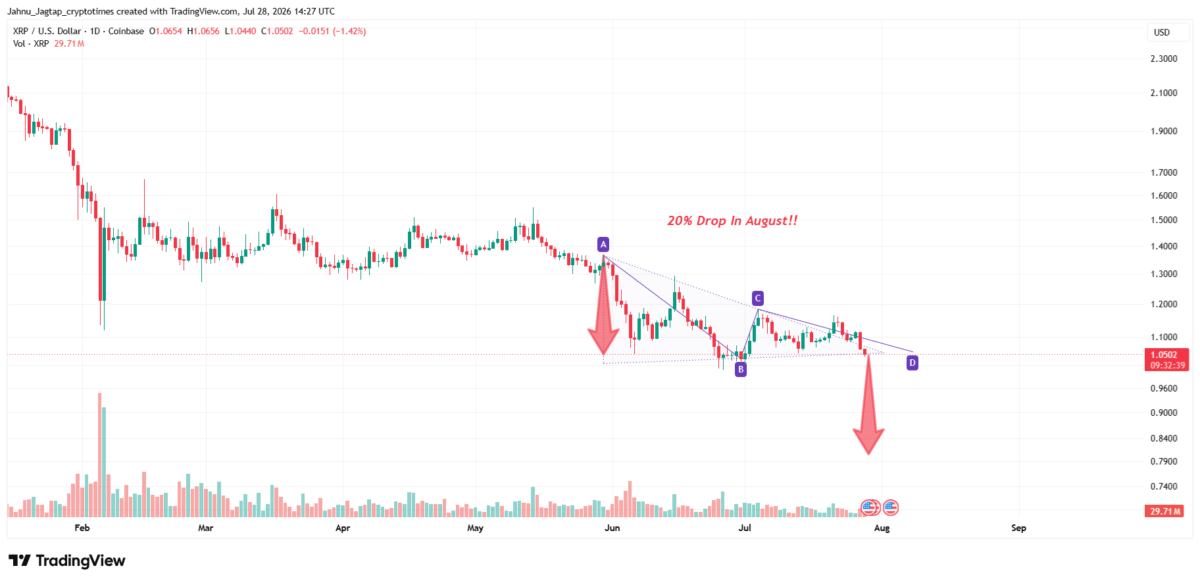
The structure has produced a sequence of lower highs since XRP fell from approximately $1.34 in early June. Although buyers defended the $1 area and pushed XRP towards $1.18 in July, the recovery failed below the descending trendline. Price has since returned to approximately $1.05, placing the support zone under pressure again.
A daily close below $1.02, followed by an unsuccessful attempt to reclaim $1.05, would confirm a bearish breakdown from the structure. The first downside area would sit around $0.95, where buyers may attempt to stabilise the market.
However, the chart’s measured breakdown points towards $0.84–$0.80 if selling pressure accelerates. A decline from $1.05 to $0.84 would represent a loss of about 20%, while a move to $0.80 would amount to a correction of nearly 24%.
This deeper target would become more credible if the breakdown occurs alongside rising volume, increasing futures open interest and another wave of long liquidations. Weak volume below $1, followed by a rapid recovery, could instead indicate a false breakdown.
The bearish setup would begin to lose validity if XRP reclaims the descending resistance line and records sustained daily closes above $1.12–$1.15. Until then, repeated tests of the $1 support increase the risk that buyers eventually fail to defend it.
XRP ETF Flows Could Decide the Breakout
US spot XRP ETFs remain one of the most important sources of potential demand.
SoSoValue data showed approximately $8.15 million in XRP ETF net inflows during the latest reported week. The figure remains positive, but it is not large enough on its own to force XRP out of the existing range.
For ETF demand to become a meaningful August catalyst, inflows would need to remain consistent across several sessions rather than arriving through isolated daily spikes.
A price breakout supported by expanding ETF demand would carry more credibility because it would show that regulated spot products are absorbing available supply.
In contrast, a derivatives-led rally accompanied by weak ETF flows would remain exposed to sudden reversals.
Fed Policy and US Regulation Remain August Catalysts
The Federal Reserve’s July 29 interest-rate decision will help determine the macroeconomic environment XRP enters in August.
A hawkish outcome that strengthens the US dollar or increases bond yields could pressure cryptocurrencies. A less restrictive policy signal could improve demand for risk assets and give XRP another opportunity to challenge its upper resistance range.
US crypto legislation could also influence sentiment.
The Senate’s scheduled state work period begins on August 10 and extends through September 11, leaving a limited early-August window for major floor activity. However, traders should avoid pricing in a CLARITY Act vote until formal Senate scheduling confirms it.
Ripple has also continued expanding its institutional products, including the July launch of Ripple Mint and further development around RLUSD, tokenisation and XRPL lending infrastructure. These developments may improve the wider ecosystem, but they should not automatically be interpreted as direct XRP demand.
Conclusion: What Is the XRP Price Target for August?
XRP’s August outlook depends on a narrow but clearly defined range.
The base-case prediction places XRP between $1 and $1.22, with a potential monthly close between $1.08 and $1.20.
A sustained breakout above $1.22 could take XRP towards $1.25 before the token challenges the more difficult $1.38–$1.46 resistance region. A move to $1.50 remains possible, but it would require stronger spot demand and represents a highly optimistic gain of nearly 43% from current levels.
On the downside, losing $1.01 would weaken the existing support structure and expose XRP to $0.95. A more severe market decline could extend the correction towards $0.85.
CryptoQuant’s volatility-coil reading suggests that the current range may eventually produce a larger move. Its positive funding-rate Z-score gives buyers a slight advantage, but neither indicator confirms which side will control the breakout.
For August, the two levels that matter most are therefore $1.01 and $1.22.
Also Read: BNB Price Prediction Aug 2026: Breakout or Breakdown Ahead?