Bitcoin closed August 2026 with a gain of 24.95%, according to CoinGlass monthly-return data, its strongest calendar month of the year and its first positive August since 2021.
The move lifted Bitcoin from the low-$60,000s at the start of the month to a late-August high above $81,000 before it settled near $78,000 into the month-end close, as per CoinGecko data.
Though the rebound did not erase 2026’s earlier damage. Market data still shows January, February and June as deep red months, and Bitcoin remains well below its October 2025 record near $126,080, as reported by CoinGecko. What August did change is the tape: a market that had spent much of the summer defending the mid-$60,000s suddenly had a monthly candle large enough to rewrite the year’s ranking table.
What drove August’s rebound
The breakout clustered around mid-month rather than arriving as a slow grind. On August 19, two Washington events landed in the same session. Treasury Secretary Scott Bessent said the U.S. Treasury would at least double long-dated bond buybacks, lifting operations from $2 billion to at least $4 billion and scheduling the larger purchases from September 9. Lower long-end yields and a softer dollar revived talk of a “debasement trade” in scarce assets such as gold and Bitcoin.
That same day, President Donald Trump hosted crypto and market-structure executives at the White House and urged Congress to pass “a fair version” of the CLARITY Act. Asked about adding to the Strategic Bitcoin Reserve — created in 2025 and funded so far with seized coins rather than open-market buying — Trump said additional purchases had “been talked about” and that he would listen to recommendations. No new government purchase was announced. The comments still mattered to positioning because they reduced the perceived odds of a hostile policy surprise.
Flows then amplified the move. U.S. spot Bitcoin ETFs took in about $517 million on August 19 and about $606 million on August 20, as per data from SoSoValue. The surrounding week’s intake was widely cited near $1.92 billion, the strongest weekly haul since October 2025.
August as a whole was on course for more than $3 billion of net creations, reversing a summer of outflows even though year-to-date ETF flows remained negative. BlackRock’s IBIT absorbed most of the demand.
Derivatives did the rest. Heavily short positioning into a quiet range meant the first decisive break above $70,000 forced covering. The Crypto Times’s reports put multi-day short liquidations in the billions of dollars, reaching as high as $3 billion in 24 hours on August 20.
Analysts at CoinShares and others described the first leg as macro-driven and the second as a squeeze plus ETF buying. That sequence — policy signal, spot demand, forced buying — is the most supportable account of why a month that usually fades instead printed close to 25%.
How August 2026 compares with past Augusts
CoinGlass’s long-run August column explains why the print looks unusual. Across 2013–2026, the average August return is +2.82% and the median is −6.99%. Only five Augusts finished higher: 2013 (+30.42%), 2017 (+65.32%), 2020 (+2.83%), 2021 (+13.80%) and 2026 (+24.95%). Four straight Augusts from 2022 through 2025 were negative.
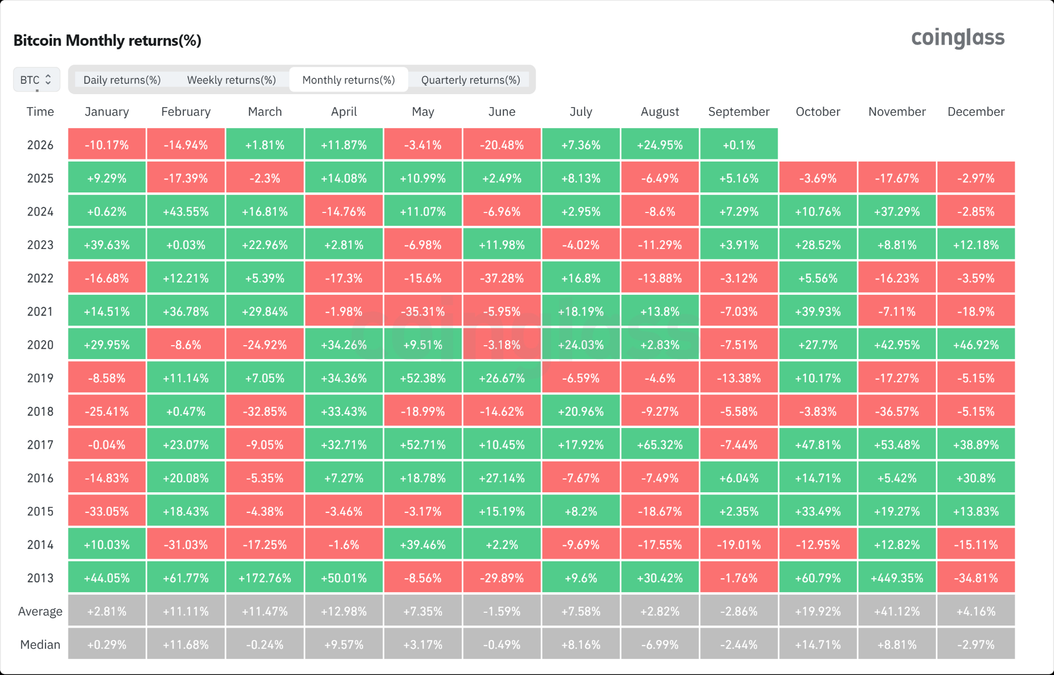
On that ledger, August 2026 is the third-best August on record, trailing only the 2017 blow-off and the 2013 bull-market surge. It is also the first green August in five years. Relative to 2026 itself, it sits far above July’s +7.36% and dwarfs April’s +11.87%, previously the year’s best month.
Seasonality is a weak signal, not a rule. The sample is short, early years had thin liquidity, and a single 65% month in 2017 still distorts the average. The useful fact is narrower: August has more often been a month that gives back gains than a month that extends them. 2026 broke that habit. Whether that break persists is a different question from whether it happened.
September’s mixed historical record
September is the month traders now map against the new close. CoinGlass’s heatmap shows a long-term September average of −2.86% and a median of −2.44% — still negative, but less severe than August’s median. In the same table, September 2025 finished +5.16%, 2024 +7.29% and 2023 +3.91%. Those three green prints matter because they cut against the older “Rektember” slogan built on 2017 (−7.44%), 2018 (−5.58%), 2019 (−13.38%), 2020 (−7.51%) and 2021 (−7.03%).
The pattern after prior strong Augusts is also mixed rather than mechanical. As the chart shows, a +30.42% August in 2013 was followed by a small September loss, then a powerful fourth quarter. In 2017, +65.32% in August preceded a September decline and a still-strong year-end. In 2021, +13.80% in August gave way to −7.03% in September and only a modest fourth quarter.
History therefore supplies a caution, not a forecast: strong Augusts have often cooled in September, but the last three Septembers were positive, and sample sizes this small do not justify trading rules.
As of 6:15 AM UTC, September 1, CoinGlass data already showed a token +0.1% for September 2026 — a placeholder, not a result.
Read: Inside Crypto’s Fastest Week of 2026: Bitcoin’s August Price Rally Was Not a Retail Story
Levels, flows, and what the close does not decide
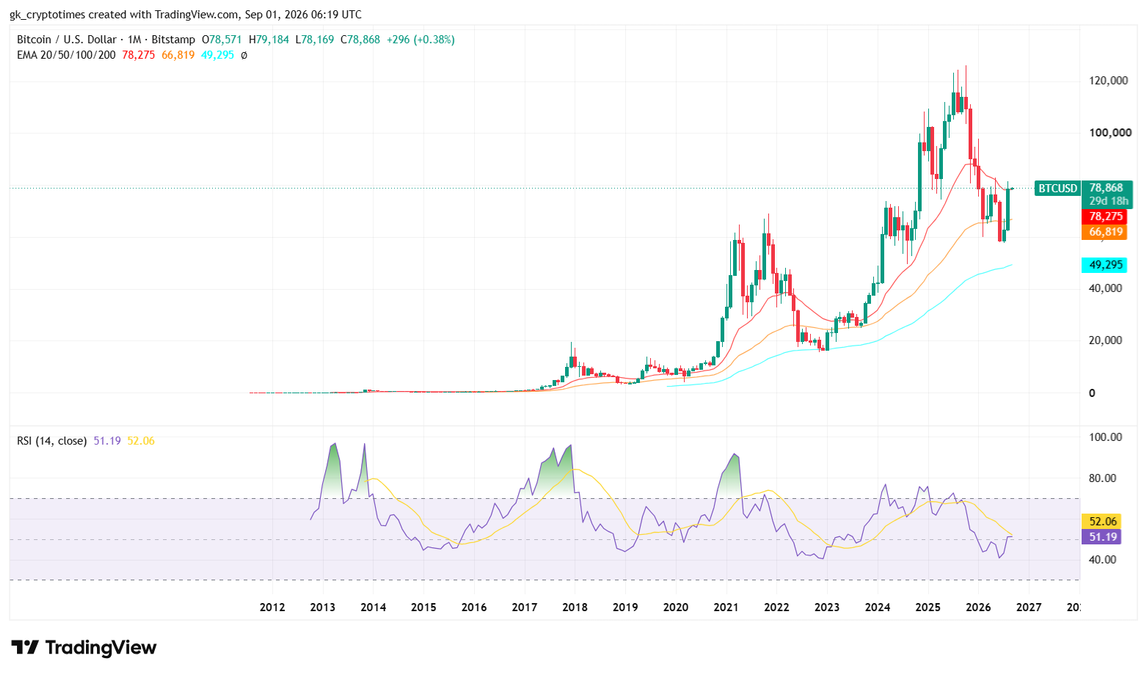
Chart from TradingView shows the monthly candle leaving Bitcoin above its 200-day moving average after reclaiming that line during the mid-August run. The $80,000 area capped the late-month high; $77,000–$78,000 is where the month actually closed.
Spot ETF assets recovered toward the high-$90 billion range (sitting at $99.61 billion, as of August 31 closing), still short of the $100 billion mark they held nearer the 2025 peak. Those are observations about positioning, not proof that the trend has changed for good.
Several tests sit immediately ahead. The larger Treasury buybacks begin on September 9. The CLARITY Act still needs Senate votes. Jobs data and Federal Reserve commentary can reprice rate-cut odds that barely moved during the August squeeze. ETF creations slowed at the month’s end, including an August 28 outflow of about $202 million-as reported by SoSoValue, a reminder that August’s inflow streak was not one-way.
A 25% August is rare on CoinGlass’s own history. It was produced by a cluster of identifiable catalysts, such as cheaper duration, a friendlier Washington tape, renewed ETF demand, and a short squeeze, not by a single headline. The same history that makes the month notable also says September has often been where those gains are stress-tested. That is the accurate reading of the close: a genuine break from a weak seasonal month, still unproven as the start of a larger trend.
Also read: Hyperliquid in Talks With Kraken Parent Owned Bitnomial For U.S. Entry