
Key Highlights
- BNB Chain recorded 41.7 million monthly active addresses, accounting for 31.8% of activity across 40 Layer-1 blockchains.
- Solana followed with 32.7 million addresses, while Tron, Bitcoin, and Ethereum recorded 18.9 million, 10.3 million, and 9 million, respectively.
- BNB Chain’s monthly active addresses rose 2.3% over the past 30 days, while Solana declined 7.5%.
Data from Token Terminal shows that monthly active addresses across 40 Layer-1 blockchains totaled 131.0 million, reflecting a 254.7% increase, as of August 11, 2026 (2:00 pm UTC). BNB Chain accounted for the largest share at approximately 41.7 million addresses, or 31.8% of the total.
According to Token Terminal data (as of 2:00 pm UTC), Solana followed BNB Chain with 32.7 million monthly active addresses, representing 25.0% of the total. Tron recorded 18.9 million, followed by Bitcoin with 10.3 million and Ethereum with 9.0 million.
Litecoin recorded approximately 4.5 million addresses, Polygon 4.3 million, Avalanche 1.5 million, and TON 1.4 million. The remaining networks accounted for about 5.2% of the total.
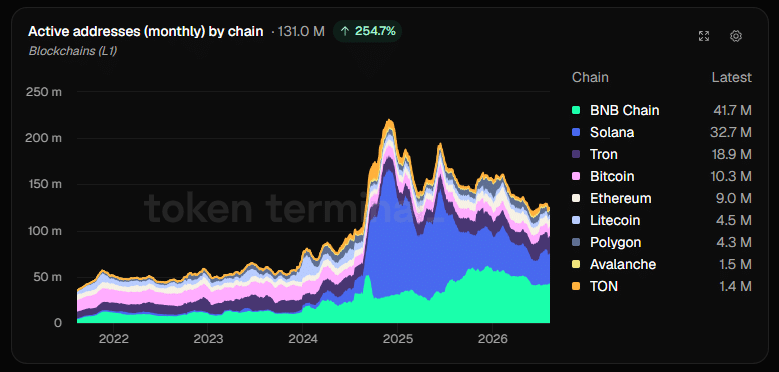
Over the most recent 30-day period, BNB Chain’s monthly active addresses increased 2.3%. Solana declined 7.5% over the same period, while Tron rose 0.4%, Bitcoin increased 8.3%, and Ethereum gained 7.5%.
The data shows that BNB Chain currently holds the largest share of monthly active addresses among the networks tracked by Token Terminal. However, address counts can vary significantly depending on transaction patterns and the methodology used to define active addresses.
Low fees support BNB Chain activity
Several factors may have contributed to the elevated activity levels observed on BNB Chain. Transaction fees on the network have remained low, with median costs frequently reported between $0.01 and $0.10.
Network upgrades implemented through 2025 and into 2026 have also reduced block times and pushed users to interact with the chain.
These changes can make the network more suitable for applications requiring frequent transactions, although the address data alone does not establish that lower fees or faster block times directly caused the recent increase.
BNB Chain has also continued to expand its broader ecosystem, including through developments around stablecoins, decentralized applications and institutional access.
Address growth differs across major chains
The BNB Chain ranking comes as activity on other major networks shows a more mixed picture.
Solana recorded 32.7 million monthly active addresses, but its figure declined 7.5% over the past 30 days. Bitcoin and Ethereum, meanwhile, recorded increases of 8.3% and 7.5%, respectively.
Ethereum also recently recorded a sharp increase in daily activity. Santiment data showed 989,500 daily active addresses on August 9, the highest single-day level since March. That metric is different from Token Terminal’s monthly active-address measure and should not be directly compared with the 9 million monthly figure in the L1 ranking.
Monthly data can smooth short-term fluctuations and provide a broader view of network participation, while daily figures can capture temporary spikes in activity.
BNB shows slight recovery
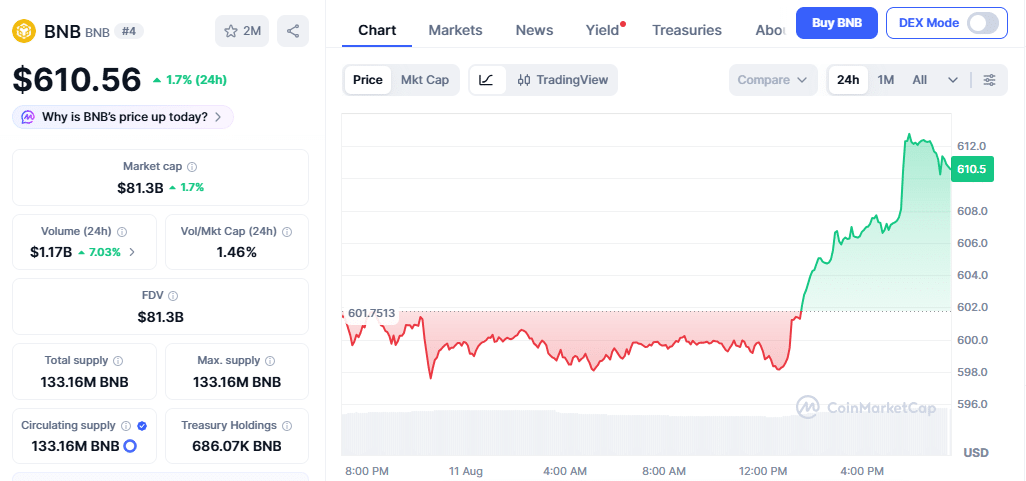
At the time of this writing, BNB was trading near $610.50, with a market capitalization of approximately $81.3 billion. The 24-hour change stood at roughly +1.7%, while the one-month change was approximately +5.2%, according to CoinMarketCap data (as of 2:00 PM UTC).
Intraday charts showed a recovery from levels near $597 earlier in the session toward the $613 range. Circulating supply remained at 133.16 million tokens. Volume over 24 hours registered about $1.17 billion. Price movement has tracked broader market conditions in recent sessions, with the token holding above short-term support levels visible on the daily and hourly charts while remaining well below its prior peaks from 2025.
Address growth does not tell the whole story
Despite BNB Chain’s lead in monthly active addresses, the metric alone does not provide a complete measure of network health.
High address totals can include low-value or automated transactions and do not necessarily translate into sustained economic throughput or protocol revenue growth. A fuller assessment would also consider transaction fees, transaction value, total value locked, stablecoin activity and the number of economically active users.
The relative positions of major networks can also change as users move between chains in response to fees, applications, liquidity and market conditions.
For now, BNB Chain leads the tracked Layer-1 networks by monthly active addresses, while the contrasting trends across BNB Chain, Solana, Bitcoin and Ethereum show that network activity remains uneven across the broader market.
Also Read: Ravencoin Falls 18% as Exchanges Suspend RVN Transfers