
Bitcoin is trading in a narrower band near the $84,000 level on Friday, September 25, days after briefly reclaiming prices last seen earlier this year. The pause follows a sharp mid-September rebound and leaves the market watching whether recent institutional buying can push the asset through resistance that rejected the first attempt.
Bitcoin changed hands at $84,277 as of 12:25 p.m. UTC, up 0.84% on the session, according to Yahoo Finance. CoinMarketCap showed a similar print of $84,229.99, with a 24-hour range of $83,306.26 to $85,230.06. Market capitalization stood near $1.69 trillion, while 24-hour volume was about $35 billion. Circulating supply remains close to 20.08 million BTC against a 21 million cap.
That cluster around $84,000 is not a collapse, nor a breakout. After printing above $87,000 earlier this week, Bitcoin has spent subsequent sessions oscillating between the mid-$83,000s and the mid-$85,000s—as shown in TradingView’s year-to-date (YTD) chart.
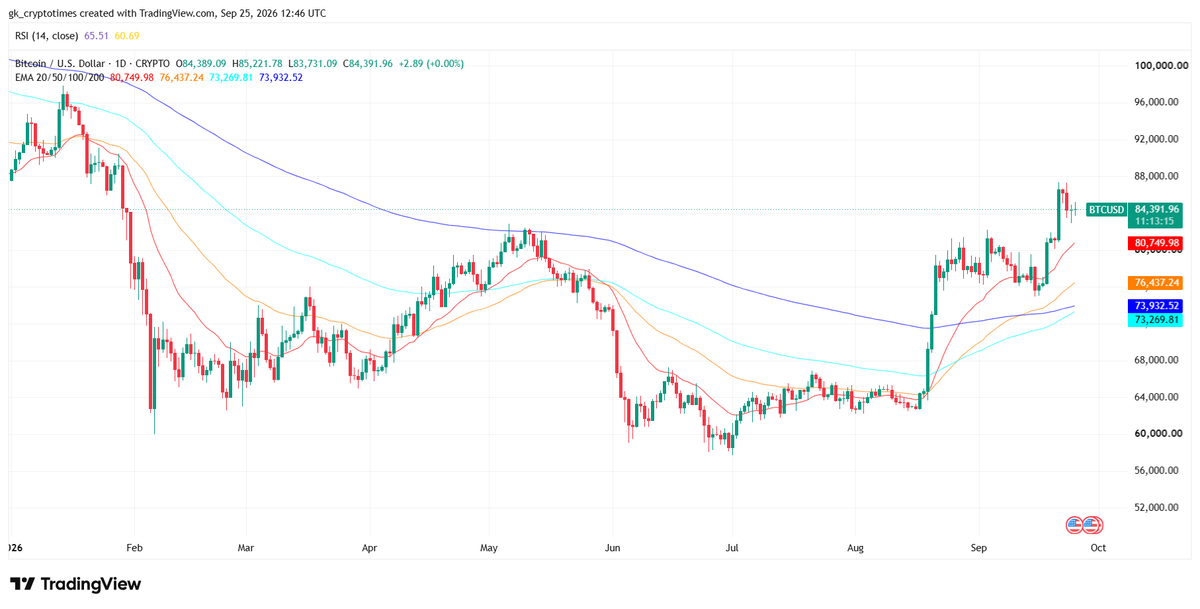
Traders often describe that kind of compression after a fast advance as a period that “builds tension,” because the next decisive move tends to arrive once the range breaks. The data so far only show a stalled tape, not a confirmed direction.
Price Tightens After the Week’s High-Water Mark
The immediate backdrop is a failed hold of the week’s highs. Bitcoin had climbed from the mid-$70,000s after mid-month pressure, then lost momentum once it tested the upper $86,000s and low $87,000s. Friday’s session high on Yahoo Finance was $85,205.35, with a day low of $83,799.59 and a previous close of $84,378.12.
That leaves spot price roughly one-third below the October 6, 2025 all-time high of $126,198.07. The 52-week range on Yahoo Finance still stretches from $57,747.77 to that same peak. In other words, the market has recovered a large share of the mid-year drawdown, but it has not restored the 2025 high.
Range-bound trade can look uneventful on a one-day chart and still matter. When price stops making higher highs after a squeeze, short-term traders often reduce size, options dealers reprice volatility, and the next catalyst—flows, liquidations, or a macro headline—has more room to force a clean break. None of that is a forecast. It is a description of how a compressed range sits between last week’s low-$80,000s support zone and this week’s rejected $87,000 area.
ETF Creations Continue as Spot Stalls
The tension is sharper because spot price has cooled while fund flows have not reversed. SoSoValue data show U.S. spot Bitcoin ETFs recorded a net inflow of $190.65 million on September 24, a sixth consecutive session of creations. BlackRock’s iShares Bitcoin Trust (IBIT) accounted for $162.63 million of that total.
The same dashboard puts cumulative net inflows since launch at $57.41 billion and total net assets at $108.92 billion, or about 6.43% of Bitcoin’s market capitalization as of September 24. Earlier sessions in the streak were larger: $346.98 million on September 23 and $714.75 million on September 22.
That combination—steady creations and a stalled spot price—has appeared before in this cycle. The Crypto Times tracked a similar pattern in late August, when spot Bitcoin ETFs absorbed about $2.8 billion over two weeks as price tested $80,000. Inflows can support a floor without immediately producing a new high if sellers appear at prior resistance.
For now, the facts are narrow. Bitcoin is holding near $84,000 after a rebound that briefly cleared $87,000. U.S. spot ETF products are still taking in cash. Volume remains active, but the daily range has tightened versus the squeeze days. Whether that compression resolves higher, lower, or into more sideways trade will depend on whether the bid from IBIT and peer funds continues to absorb supply at current levels.
Prices move continuously. The figures above reflect the market as of midday UTC on September 25, 2026, and can change within minutes.