
Bitcoin is trading roughly 50% below its all-time high after more than 40 weeks of decline, and a detailed analysis from Blockworks Research suggests the market may be approaching a high-timeframe cycle low in both price and time.
Luke Leasure, Head of Research at Blockworks, outlined a set of rare, high-timeframe indicators that have historically coincided with major bottoms and subsequent multi-year outperformance. The findings, shared in a comprehensive post on X, frame the period between now and the end of 2026 as a potentially compelling zone for long-term reaccumulation.
The analysis emphasizes that Bitcoin has delivered flat performance against the Nasdaq since late 2017 and against its own March 2021 levels when measured over long windows, while carrying substantially higher volatility.
As the asset matures, Leasure argues, passive always-long exposure is likely to produce diminishing marginal returns. Identifying opportunistic windows for increased or reduced exposure therefore becomes more important.
The indicators examined spend most of their history in neutral territory and only flash meaningful signals at extremes a few times per decade. Several of those extremes are present simultaneously today.
Extreme Relative Strength Readings Signal Historic Oversold Conditions
One of the strongest signals comes from the relative performance of Bitcoin against the Nasdaq 100. Leasure constructed a smoothed 14-period RSI on the weekly Nasdaq/BTC ratio using 875 periods of data. Elevated readings on this measure indicate the Nasdaq is overbought relative to Bitcoin; depressed readings show the opposite.
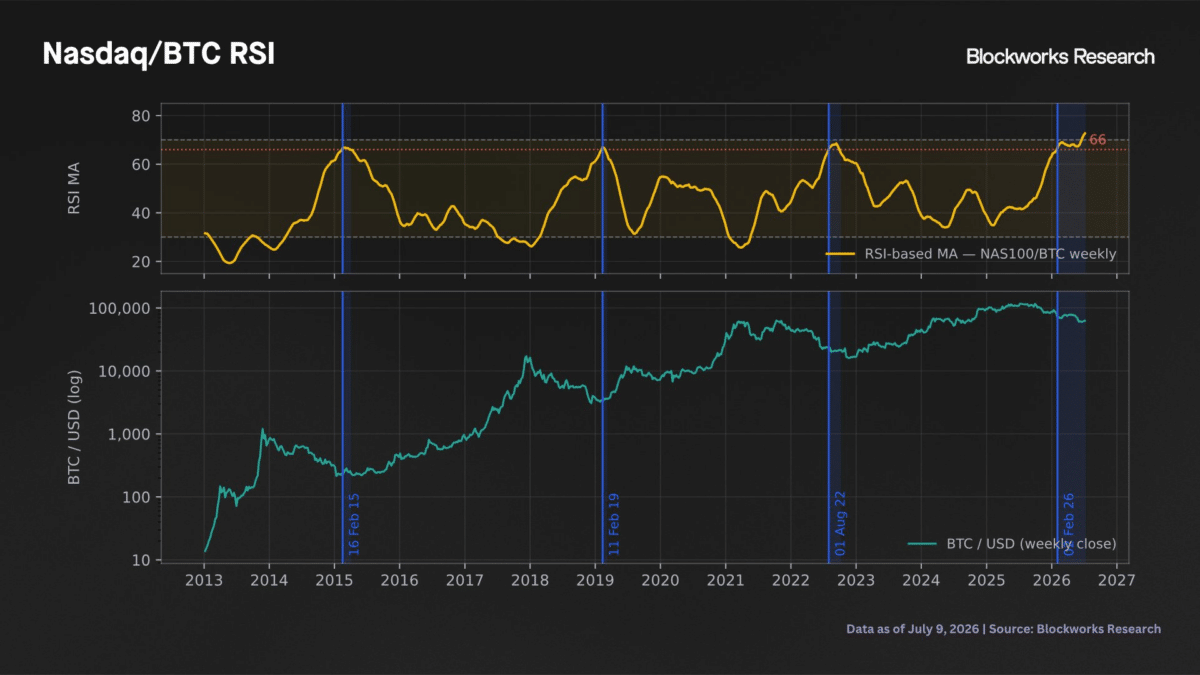
The current smoothed reading of 72.6 is the highest ever recorded, exceeding the previous peak of 68.5 set in 2022. The episode has already lasted 24 weeks—longer than any prior occurrence—and readings above 70 have only appeared in the past month.
Historically, such extremes have been rare, occurring in just four episodes since 2010: 2015, 2019, 2022, and the current stretch that began in late January 2026. Forward returns from the start of these episodes showed little reliable signal over 30 to 120 days but turned decisively positive for Bitcoin over one- to three-year horizons, both in dollar terms and relative to the Nasdaq.
Each successive cycle produced smaller percentage gains, consistent with the theme of diminishing returns, yet Bitcoin still outperformed the equity index substantially on the longer timeframes.
A parallel indicator built on the Gold/BTC ratio reached its most extreme overbought reading for gold (and therefore most oversold for Bitcoin) in February 2026. Elevated readings on this pair have also clustered near historical Bitcoin cycle lows and been followed by multi-year outperformance versus both gold and the dollar.
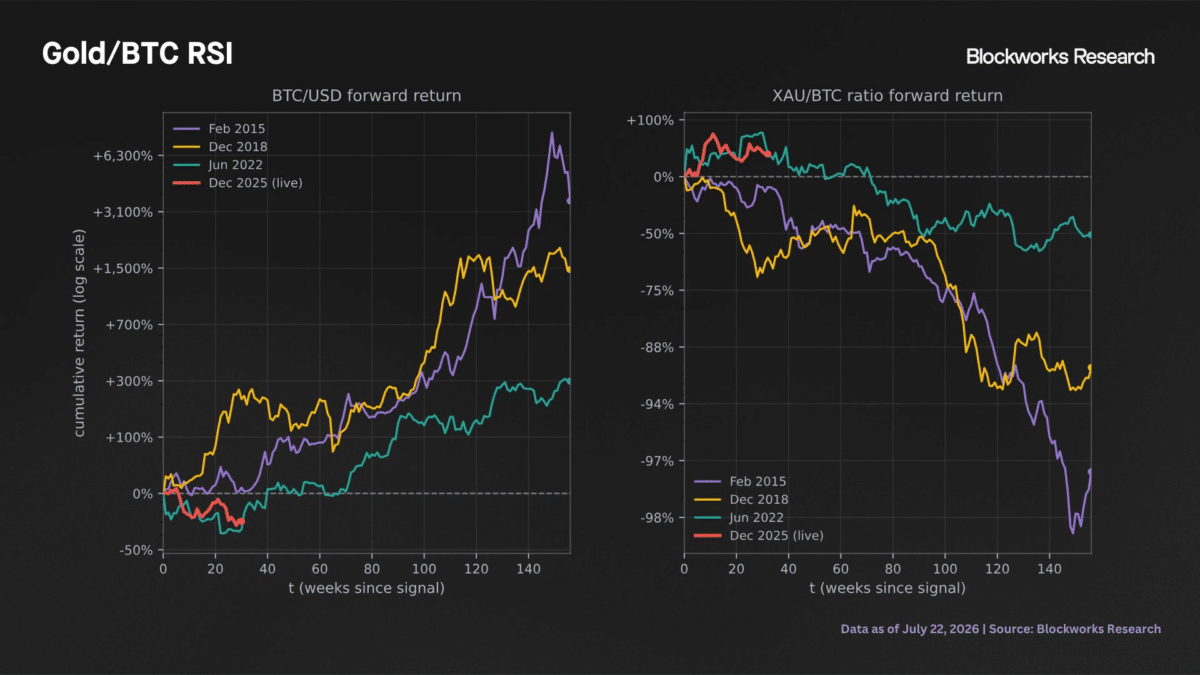
Together, the two relative-strength measures portray Bitcoin as unusually cheap against both a risk-asset benchmark and a traditional monetary store of value.
Realized Price and Historical Cycle Timing Point to Late 2026 Low
On-chain data reinforces the picture with Bitcoin realized price—the estimated aggregate cost basis of all circulating Bitcoin based on the last on-chain transfer price—currently sits near $53,000, about 18% below the spot market.
Only 12% of Bitcoin’s price history has traded below this level. Every prior bear-market low occurred at a discount to realized price, and the first weekly closes beneath it have historically marked the terminal phase of those declines rather than the beginning or middle. Returns measured from those points over the subsequent 150 weeks have been positive and significant, again with progressively smaller magnitudes across cycles.
Cycle structure measured in both price and time provides an additional timing anchor. In the 2013, 2017, and 2021 cycles, the price trough was typically set by roughly week 60 from the all-time high. The current cycle stands at approximately week 40 with a 50% drawdown, tracking within the historical range of prior paths. If the pattern holds, a low would be expected by the end of November 2026.
The analysis also notes that the time required to reclaim a new all-time high has compressed with each cycle. Extrapolating that trend points to potential new highs before February 2028, though both observations rest on a small number of completed cycles and carry no causal mechanism.
Leasure stresses that a move toward or below the $53,000 realized-price level would be consistent with historical patterns rather than a violation of them. The market has already derisked substantially from the elevated multiples seen in 2025.
“The first close below realized price has historically marked the terminal phase of the bear market, not the beginning or middle of it,” he said. “Regardless, BTC’s spot price multiple to realized price has retraced substantially from the previously elevated levels of 2025, signalling that the market has derisked.”
Implications for Long-Term Investors Amid Diminishing Returns
Combining these inputs, the research constructs illustrative scenario bands by scaling down the three-year trajectories that followed previous signal episodes. The bands account for progressive return compression and show mixed performance into the end of 2026 but a decisive turn positive and asymmetric to the upside through 2027 and 2028.
The shaded ranges represent historical post-signal paths under reduced strength; they do not claim to capture every possible outcome and contain no distribution for a failed signal.
Important caveats accompany the conclusions. Sample sizes are small—effectively three or four independent episodes for the relative-strength and realized-price studies—and a single divergent cycle would weaken the observed relationships. The various metrics largely measure the same underlying fact of a deep, prolonged drawdown and should not be treated as fully independent corroboration.
Structural changes, including ETF-intermediated ownership, corporate treasury holdings, and a deeper derivatives market, introduce the possibility that earlier patterns no longer apply. Relative-strength signals also say little about nominal price paths if equities or gold experience broad declines.
Despite these limitations, the confluence of rare extremes leads Leasure to conclude that Bitcoin is likely at or near a cycle low, with that low expected by year-end if it has not already been set.
Also read: New Jersey’s $33B Police & Fire Fund Increases Position in Michael Saylor’s Bitcoin Treasury