
Bitcoin has staged a notable recovery from June lows, climbing back above the psychologically important $63,000 level in early July 2026 after testing lows near $59,000. The move reverses some of the sharp losses that closed out the second quarter and has reignited debate among traders and analysts: Does this mark the end of the corrective phase following the 2025 all-time high near $126,000, or is it merely a dead-cat bounce before further downside?
As of early July 6, 2026, BTC trades in the $63,000 zone, showing modest daily gains and weekly advances of around 5% in spots. The rebound comes amid thinner holiday trading volumes and has been supported by short-covering alongside modestly friendlier macroeconomic signals.
This price action occurs against the backdrop of a roughly 50% drawdown from Bitcoin’s October 2025 peak. While long-term holders and institutional infrastructure remain in place, on-chain and derivatives data present a mixed picture that leaves the near-term direction uncertain.
Bitcoin’s Recent Correction and Rebound
Bitcoin entered 2026 in a corrective mode after its late-2025 surge. Prices slid through the first half of the year, with accelerated selling pressure in May and June pushing the cryptocurrency to multi-month lows around $58,000–$60,000.
By late June, BTC briefly traded below $60,000 for the first time in roughly 21 months in some sessions, coinciding with ETF outflows, broader risk-off sentiment in equities, and rotation into other assets. The selloff left Bitcoin hovering near its realized price — the average on-chain acquisition cost of all coins — a level historically associated with value zones or bear-market floors in prior cycles.
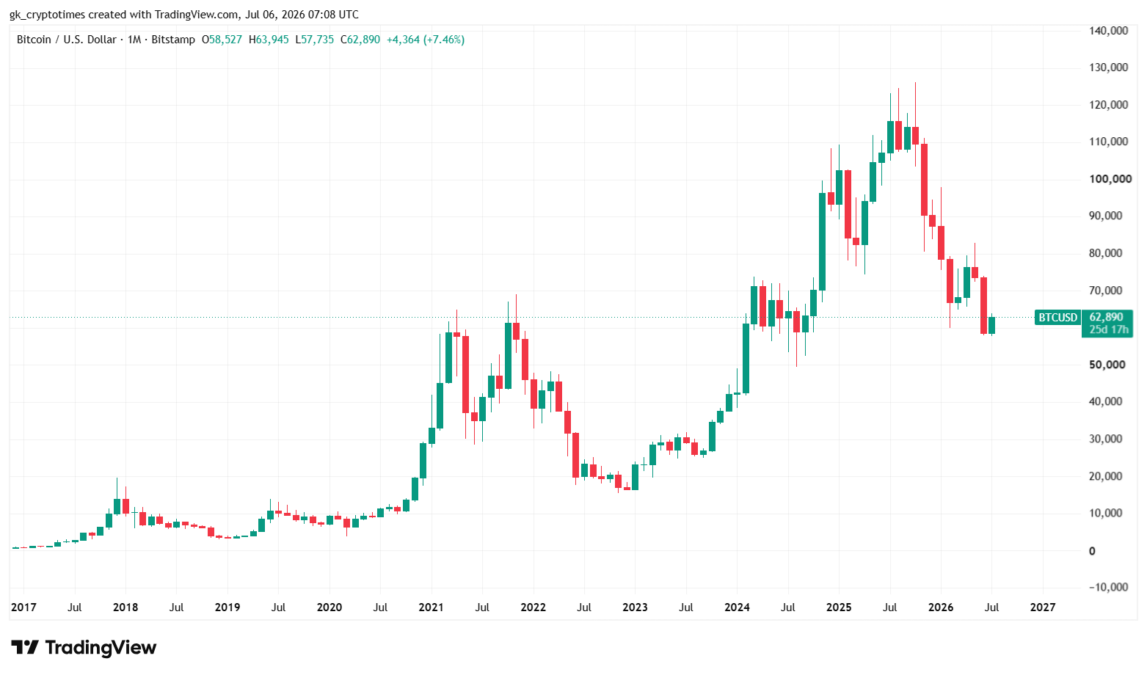
The rebound gained traction in early July. Bitcoin climbed above $63,000 for the first time in two weeks, fully reversing end-of-June losses during relatively thin Independence Day holiday trading. The move extended a week-long recovery built on short squeezes and macro developments, including softer-than-expected U.S. jobs data and comments from Federal Reserve officials suggesting inflation risks had eased.
Technically, the cryptocurrency is now trading near its 200-week moving average (approximately $62,600) and has reclaimed several short-term exponential moving averages. Key resistance sits at $63,800 in the immediate term, with heavier clusters around $65,000–$70,000. Support has been established in the $59,000–$60,000 zone following the June test.
A decisive daily or weekly close above $63,800 would strengthen the bullish case, while a failure to hold $60,000 could reopen the path toward $56,000 or lower in more bearish scenarios.
Factors Supporting a Potential Market Bottom
Several elements lend credence to the view that the worst of the correction may be behind Bitcoin. Coinglass data show the asset trading relatively close to its realized price, a zone that has often marked accumulation phases rather than capitulation in previous cycles.
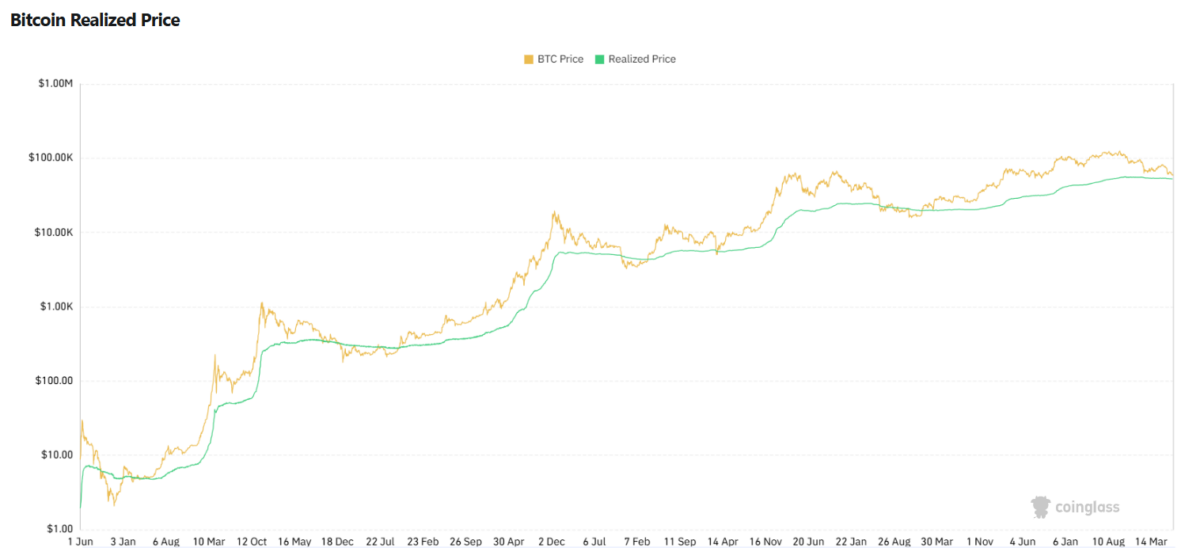
The current correction, while painful, has been milder in percentage terms than the deep bear markets of 2018 or 2022. Some analysts, including references to institutional voices like Cathie Wood, have pointed to shrinking drawdown magnitudes and the maturation of Bitcoin’s market structure — bolstered by spot ETFs, corporate treasuries, and growing regulatory clarity — as signs that structural support has improved.
Derivatives markets have shown signs of a pause rather than outright panic. Open interest has remained relatively steady even as futures volumes dipped, and certain options flows have priced in a potential bounce toward $75,000 by late July in more optimistic positioning.
Macro conditions could also turn supportive. Softer inflation prints and labor market data have reduced immediate hawkish pressures, potentially paving the way for more accommodative policy later in 2026. In a post-halving cycle environment (the April 2024 halving now more than two years in the rearview), historical precedent suggests that periods of consolidation and fear often precede the next leg higher once accumulation completes.
Long-term holders continue to demonstrate conviction, with supply held by these cohorts remaining elevated despite price weakness. This behavior has historically been a reliable leading indicator for eventual recoveries.
Risks of Further Downside and the “Dead Cat Bounce” Scenario
Despite the rebound, caution remains warranted. Earlier data around the $63,000 level revealed weakening demand dynamics. Total Bitcoin demand contracted sharply in mid-June — the largest weekly drop since early 2022 in one reported instance — while spot Bitcoin ETF inflows turned negative or slowed significantly.
This suggests institutional buying pressure has not yet returned in force, leaving the market vulnerable to renewed selling if macro conditions deteriorate or risk sentiment sours again. High fear readings persist across sentiment gauges, and a substantial portion of the supply sits in loss, which can fuel further capitulation if prices retest lower supports.
Technically, the broader structure still shows signs of strain. Multiple red monthly closes and the breach of key trendlines earlier in the year have kept bears on alert. Market analysts explicitly label the current move a potential “dead cat bounce” — a temporary recovery within a larger downtrend — warning that failure to sustain gains above $63,800–$65,000 could lead to a retest of June lows and possibly extension toward the $50,000–$55,000 zone.
Liquidity considerations and the “Monday curse” phenomenon (noted in recent trading commentary) add another layer of short-term unpredictability. Thin holiday volumes amplified the recent bounce, but follow-through buying will be needed once markets normalize.
On-chain and derivatives data continue to show a market that is closer to a value accumulation zone than a confirmed breakout. Without a clear turnaround in ETF flows and broader demand metrics, any rally risks being viewed as a relief move rather than the start of a new uptrend.
Outlook: Data-Dependent Path Ahead
Currently, Bitcoin’s reclaim of $63,000 represents meaningful short-term progress after June’s washout, but it does not yet resolve the larger corrective phase that followed the 2025 highs.
The coming weeks will likely hinge on whether price can convert the $63,800 resistance into support, whether ETF and on-chain demand metrics stabilize or improve, and how macroeconomic data — including upcoming Federal Reserve communications — influences risk appetite.
A sustained move higher with improving fundamentals would support the “bottom in” narrative and potentially set the stage for a retest of higher levels later in 2026. Conversely, a quick rejection and breakdown below recent supports would reinforce concerns of additional downside before a more durable low forms.
Also read: CLARITY Act Faces Aug. 7 Deadline as July 4 Target Slips and Obstacles Mount