Key Highlights
- XRP’s 30-day MVRV ratio has plunged to -47%, its deepest reading since December 2020, signaling extreme capitulation among short-term holders.
- Santiment data shows the average active XRP trader is nearly half underwater, with whale activity dropping 57% in the past week even as ETF inflows remain positive.
- Historically, MVRV readings this extreme have preceded sharp recoveries, but macro risks including CLARITY Act delays and Bitcoin weakness could extend the drawdown.
XRP is trading near $1.35 as of May 27, 2026, and under the surface, on-chain data is flashing one of the most extreme capitulation signals in the token’s history.
According to data from Santiment Intelligence, XRP’s 30-day Market Value to Realized Value (MVRV) ratio has collapsed to -47%, meaning the average trader who has been active in the past month is sitting on a nearly 50% unrealized loss. This is the lowest 30-day MVRV reading since December 2020, just before XRP staged a multi-month rally that eventually carried it above $1.50 in April 2021.
The 365-day MVRV is not far behind, sitting at approximately -36%, according to Santiment’s Brian Quinlivan, who discussed the metric during a livestream on May 22.
What MVRV Actually Tells You
MVRV compares the current market price of an asset to the average price at which active holders acquired their tokens. When the ratio is deeply negative, it means the majority of recent buyers are underwater — a state that historically correlates with exhausted selling pressure and elevated probability of a reversal.
Santiment’s chart highlights two clearly defined zones: a red “Danger (Sell) Zone” where MVRV readings above roughly +20% have historically preceded local tops, and a green “Opportunity (Buy) Zone” where deeply negative readings have preceded strong recoveries. XRP currently sits well below the opportunity threshold.
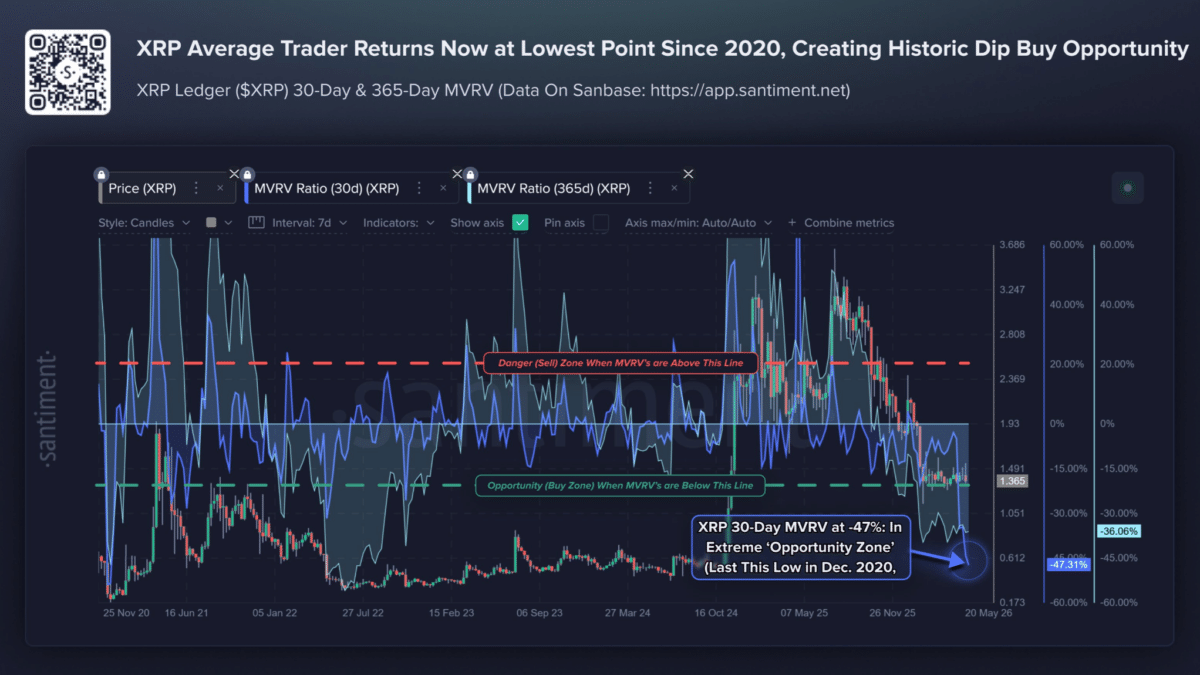
The analytics firm noted that deeply negative MVRV zones tend to appear when retail traders have largely capitulated, creating conditions where even small positive catalysts can trigger outsized recoveries.
Divergence Between On-Chain Weakness and Institutional Demand
The MVRV signal arrives alongside a sharp divergence in market behavior. Whale transactions valued above $1 million have dropped 57% in just nine trading sessions, falling from 157 to 67, according to CoinMarketCap data from May 25. This compression in large-holder activity typically precedes lower volatility and tighter consolidation — essentially a market waiting for a catalyst.
Yet institutional demand remains intact. Spot XRP ETFs attracted $12.57 million in net inflows for the week ending May 23, outperforming both Bitcoin (which saw $1.15 billion in outflows) and Ethereum ($209 million in outflows). This marks the second consecutive week in May where XRP fund flows outpaced the two largest crypto assets. Cumulative ETF inflows since the November 2025 launch have now reached approximately $1.32 billion.
On-chain wallet creation also surged. Santiment reported 4,300 new XRP wallets created within 24 hours around May 21, the fourth-largest daily spike of 2026. Daily active addresses climbed from 32,000 to 43,520 over the same period.
Three Scenarios From Here
Scenario 1: Mean-Reversion Rally
Every prior instance of XRP’s MVRV hitting this extreme on Santiment’s chart — late 2020, mid-2022, late 2023 — preceded a significant rally. The logic is mechanical: weak hands have already sold, selling pressure is exhausted, and relatively small buying volumes can move the price sharply higher.
A catalyst like a full Senate vote on the CLARITY Act, which cleared the Senate Banking Committee 15-9 on May 14, could trigger a snap toward $2.00–$2.50. XRP ETF inflows and the 800 million XRP float reduction from ETF custody further tighten the supply side.
This is the highest-probability outcome based on historical pattern-matching alone.
Scenario 2: Relief Bounce Into Renewed Distribution
XRP bounces 20–40% as MVRV normalizes back toward zero, but the rally stalls once it enters the danger zone. Traders who bought the dip take profits, and the overhead supply wall near $1.76–$1.80 — where an estimated 1.85 billion XRP is held at breakeven — caps upside.
This would look like a grind back toward $1.80 followed by another leg down into range-bound trading between $1.30 and $1.80. The CLARITY Act’s uncertain full-Senate timeline supports this scenario: the bill still needs 60 votes to clear a filibuster, and an ethics dispute over crypto holdings by officials is blocking progress.
Scenario 3: Extended Capitulation
MVRV readings this extreme do not guarantee a bottom. If Bitcoin breaks down below key support, or if the CLARITY Act stalls into 2027, XRP could see its 365-day MVRV converge with the 30-day reading at -47% or below — a far more severe structural breakdown indicating that even long-term holders are underwater.
The XRP price could drift toward $1.00–$1.14 before a mean reversion plays out, similar to the extended negative MVRV regime visible during mid-2022. An analyst symmetrical triangle breakdown pattern flagged on May 25 projects a potential downside target near $1.14.
Key Level to Watch
The critical divergence is between the 30-day MVRV (-47%) and the 365-day MVRV (-36%). As long as the longer-term reading remains less extreme than the short-term one, it suggests longer-term holders retain relatively more conviction than recent buyers — a setup that historically favors Scenario 1 or 2 over Scenario 3.
If the 365-day MVRV catches down to the 30-day reading, the structural picture deteriorates significantly.
XRP’s 200-day moving average sits at approximately $1.45, and the token is currently trading below all key EMAs (20/50/100/200). The RSI hovers near 41–43, signaling weakening momentum but not yet oversold conditions.
Also Read: Pump.fun Adds Ethereum, Base and BNB Chain Trading to App