Key Highlights
- Bitcoin dips to $82K, testing key support, while altcoins surge, showing traders seek opportunities amid market uncertainty.
- Analysts flag $73K–$84K as potential max-pain zones, signaling a possible market shake-up and critical moment for traders.
- Major crypto holders face mixed outcomes: BTC shows big unrealized gains, while ETH and SOL holders endure significant losses.
Bitcoin (BTC) faced a sharp decline today and dropped to $81,500, its lowest since April, raising alarm among traders. According to CoinMarketCap, Bitcoin has fallen over 10% in the last 24 hours and 15% across the week. Meanwhile, the global crypto market cap slid to $2.83 trillion, down 9.53%, while total 24-hour trading volume jumped 39.19% to $249.68 billion.
Bitwise Europe Research Head André Dragosch outlined the possible max-pain levels, citing BlackRock’s IBIT cost basis near $84,000 and MicroStrategy’s average cost around $73,000.
“Think max max pain is reached the moment we tag either the IBIT cost basis at 84k or MSTR cost basis at 73k,” Dragosch stated on X, adding, “Very likely we’ll see a final bottom somewhere in between. But these will be fire sale prices and akin to a full cycle reset imo.” This means the market could see a big shake-up if Bitcoin hits either price point, making it an important moment for traders to watch closely.
Altcoins gain market share
The market is not just focused on Bitcoin. CryptoQuant analyst JA Maartun reported that altcoins now represent 60% of Binance’s trading volume, the highest since early 2025. Bitcoin and Ethereum (ETH) combined hold just 20% of trading activity, indicating traders are seeking opportunities outside the top two coins.
“This data reflects where actual trading activity is happening, and right now, it’s heavily concentrated outside the majors,” Maartun confirmed.
When altcoin trading rises, it usually means people are speculating more. Traders might be chasing quick gains on smaller coins, showing caution toward Bitcoin even as its long-term trend stays strong.
Bitcoin’s technical outlook
According to TradingView, the Bitcoin weekly chart still portrays a long-term uptrend, but for now, a steep correction is in play. The 50-week EMA lies at approximately $100,032, whereas the 200-week EMA is hovering at $66,154. The 50 EMA and 200 EMA usually show the average price of 50 and 200 periods, respectively, and indicate short-term and long-term market momentum.
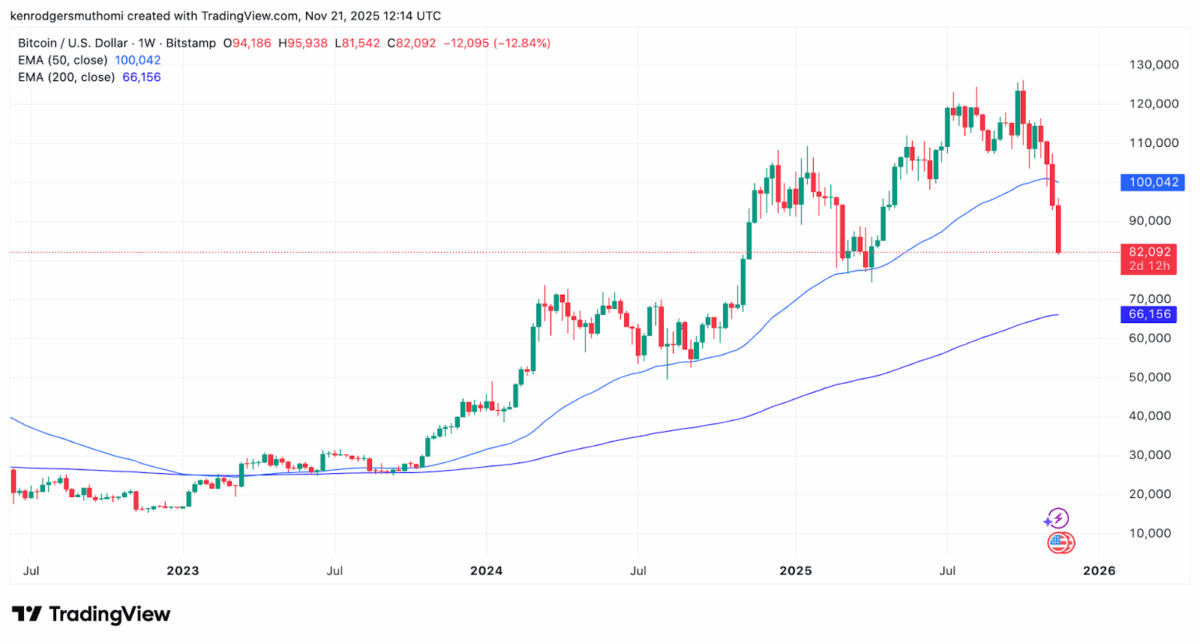
Bitcoin recently fell below the 50-week EMA after weeks of decline, signaling weak short-term bullish momentum. Price interactions with the long-term channel’s lower boundary have often acted as support, and Bitcoin currently trades near this zone.
The asset started the week at $94,186 but slid to $81,542 before consolidating around $82,000 to print a weekly loss of over 13%. Past local highs around $120,000 demonstrated how sellers were slowly dominating buyers. Regardless of this, Bitcoin remains above the 200-week EMA, showing strength in the long term.
Blockchain analytics firm Lookonchain had a different story whereby the platform showed how different big crypto holders are feeling the market volatility. Strategy’s 649,870 BTC, bought at around $74K each, is sitting on $6.15 billion in unrealized gains. On the other hand, Bitmine’s 3.56 million ETH, bought at about $4,010 each, is facing $4.52 billion in potential losses.
Forward Industries’ 6.83 million SOL, bought at $232 each, shows an unrealized loss of $711 million. With the same market moves, the effect is not the same on investors in terms of losses and gains.
Also Read: Crypto Markets Turn Red While ETFs Record Huge Outflows