
Bitcoin traded with a wide intraday range on September 30 after the U.S. Bureau of Economic Analysis published its Personal Income and Outlays report for August. The release showed the Federal Reserve’s preferred inflation gauge rising less than many market forecasts had implied, prompting a brief rally toward the mid-$85,000s before the advance faded.
By early October 1 (6:15 AM UTC), the price was again clustered in the low-to-mid $83,000s to low $84,000s, inside the band that has contained most trading since the late-September pullback from the month’s high near $87,000—as per CoinGecko data.
The episode illustrated how closely short-term crypto pricing remains tied to U.S. rate expectations even after a strong third-quarter recovery. Traders treated the cooler inflation figures as a reason to reduce the odds of another near-term hike, then reassessed once longer-term Treasury yields failed to ease in a sustained way. The result was a classic data-day whip-saw rather than a clean directional break.
Cooler core prices meet strong spending
The Bureau of Economic Analysis said personal income increased $66.6 billion, or 0.2%, in August. Disposable personal income rose $68.6 billion, or 0.3%. Personal consumption expenditures increased $190.8 billion, or 0.9%, with goods accounting for $114.1 billion of the rise and services $76.7 billion. In real terms, personal consumption expenditures rose 0.6%.
On prices, the PCE price index increased 0.3% from the preceding month and 3.4% from August 2025. Excluding food and energy, the index rose 0.2% on the month and 3.0% from a year earlier. The personal saving rate was 4.1%. Those year-over-year inflation readings were below the levels many desks had penciled in ahead of the 8:30 a.m. Eastern release, which is why risk assets, including Bitcoin, initially firmed.
The composition of the report was less uniformly soft than the headline inflation comparison suggested. Spending accelerated sharply even as real disposable income was unchanged on the month. That mix—cooler prices alongside resilient consumption—left room for two readings. One is that inflation pressure is easing enough for the Federal Reserve to pause. The other is that demand remains firm enough to keep policymakers cautious. Bitcoin’s path on the day tracked that ambiguity: an initial bid on the inflation surprise, then a fade as the spending strength and sticky yields re-entered the conversation.
The Federal Reserve raised its policy rate in September, the first increase in roughly three years, and markets had spent the following two weeks marking up the chance of a further move at the October 27–28 meeting. A softer core PCE print reduced that pressure in pricing, but it did not erase the broader backdrop of elevated real yields and energy costs. Oil had been trading above $100 a barrel in recent sessions, a factor that can feed into headline inflation even when core measures moderate.
How the Bitcoin tape reacted
Spot Bitcoin moved from the low $83,000s to a session high near $85,650 within roughly an hour of the release, according to widely followed exchange prints, then reversed toward $83,000 before stabilizing. The full September 30 range ran from about $82,900 to $85,650. Early October 1 quotes sat near $84,000, a modest recovery from the post-data low but still well below the September 21–22 peak around $87,400—as shown in TradingView’s 5-days chart.
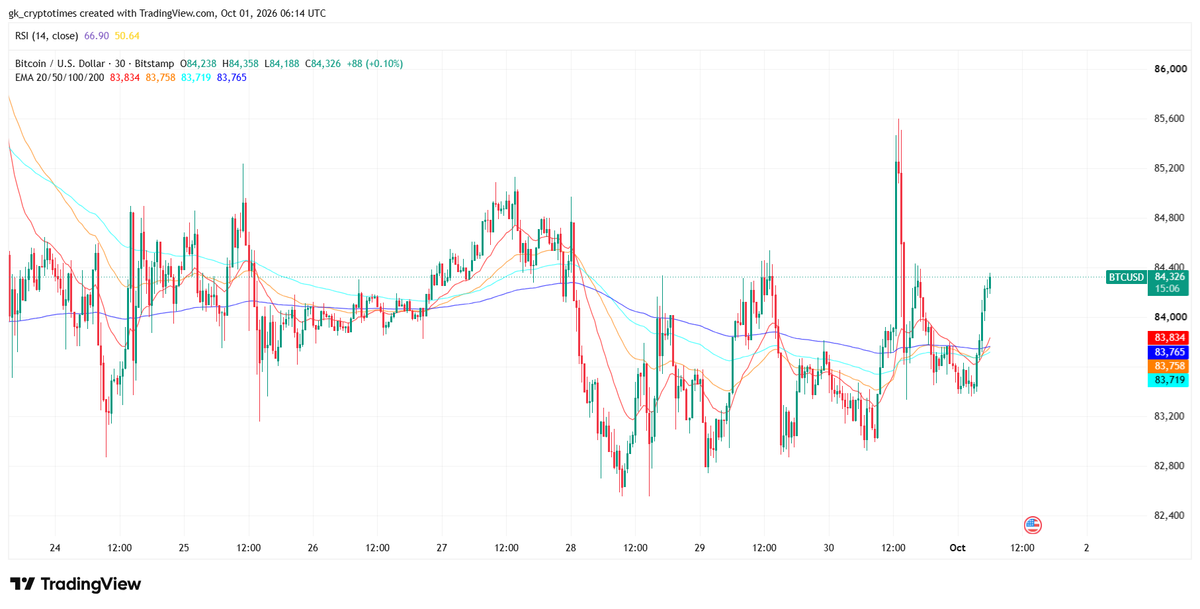
The swing liquidated leveraged positions on both sides. Estimates circulating from Coinglass put roughly $60 million of liquidations in the first hour, split between longs and shorts, consistent with a two-way stop run rather than a one-sided flush. Open interest in Bitcoin futures had already been declining through late September, so the data-day move occurred in a market with less leverage than during the mid-month rally.
That rally itself had been supported by spot demand. U.S. spot Bitcoin exchange-traded funds recorded their strongest weekly inflows of 2026 in the sessions through September 25, on the order of $2.4 billion—as shown in SoSoValue dashboard—before daily flows cooled and turned modestly negative on September 30.
Corporate buyers also remained active. Strategy disclosed a further purchase of 1,665 bitcoin between September 21 and September 27 at an average price near $85,681, taking reported holdings to about 847,666 bitcoin. Those flows helped explain why the late-month pullback stayed inside a range rather than extending toward the summer lows near $58,000.
The low-$80,000s held ahead of October has therefore become the practical reference zone. Supply from holders who accumulated between roughly $84,000 and $86,000 has capped rebounds, while bids have appeared on dips toward $83,000. A separate look at on-chain profit-taking shows long-term holders accounting for a larger share of realized gains into the quarter-end, a pattern that can slow upside even when macro data is not outright hostile.
Implied volatility did not reprice as violently as spot. Front-end options moved, and a brief rise in short-dated convexity was visible in exchange surfaces, but 30-day implied volatility remained in the mid-30s, close to recent realized readings. Traders had already reduced leverage ahead of the print, which limited the feedback loop from liquidations into a larger trend day.
Yields, the October meeting, and the next data
The constraint on the rally was the bond market. The 10-year Treasury yield remained near its highest levels since 2007, trading around 5.3% after the PCE release, and the 30-year yield stayed close to multi-decade highs. A cooler inflation print would normally pressure yields lower; the fact that it did not, at least not durably, told crypto desks that the term premium and fiscal supply concerns were still dominating the inflation surprise.
Market-implied odds of an October rate increase fell after the data, with several futures-based readings moving from the high-60s or low-70s percent area into the mid-30s. Those probabilities are derived from fed funds futures and can shift again before the meeting. New York Fed President John Williams had said a day earlier that there was no need for urgency on further increases, a remark that already leaned against an automatic follow-up hike. The PCE figures reinforced that tone without locking in a decision.
What the report does not settle is the path into the year-end. The next labor-market release, the September employment report, is due October 2 and can reprice the same meeting odds within hours. A soft payrolls number would extend the relief seen on September 30; a firm one would revive the hike discussion and test the $83,000 area again. Bitcoin’s sensitivity to that sequence has been high all month: the coin rallied through mid-September as ETF demand returned, stalled when yields jumped, and then chopped around the PCE release.
The September close and “Uptober” setting
September still closed higher, on the order of 6 to 7%, ending a long streak of weak Septembers and contributing to a third-quarter gain of roughly 40% from the early-July low. That quarterly result is the second context traders are weighing against the day-to-day noise. The recovery from about $58,000 has been large, yet the price remains about a third below the October 2025 peak near $126,000.
Read: Inside Bitcoin’s September 2026 Rally: BTC Reclaiming $87K, $2B in ETF Inflows and a Short Squeeze
Positioning into “Uptober,” the seasonal label some desks apply to October, is therefore split between those treating the low $80,000s as a base and those watching $84,000–$85,000 as supply that must clear before a new leg.
Equity proxies told a related story. Strategy shares outperformed Bitcoin over the past month even as the common stock remained volatile around the latest purchase disclosures, a reminder that listed vehicles can amplify both the inflows and the macro swings. Broader risk assets were mixed on September 30: gold firmed toward $4,200 an ounce on the inflation print, while U.S. equity indexes finished only modestly changed once yields rebounded.
For Bitcoin, the practical takeaway from the PCE session is narrower than the initial headline. The August inflation data were cooler than forecast and spending was strong, a combination that eased October hike odds without producing a sustained break above the recent range. Until yields ease or spot demand re-accelerates, the market is more likely to keep testing the same $83,000–$85,000 band than to trend on a single data point. The employment report on October 2 is the next scheduled test of that balance.
Also read: Is ‘Paul Le Roux’ Really Satoshi Nakamoto? What the Record Actually Shows