
Key Highlights
- Bitcoin’s August 2026 performance stands at +26.07% as of August 29, reviving discussion over whether September could break its historically bearish seasonal pattern.
- Historical monthly-return data cited by an X account shows that Bitcoin has not posted a green September immediately after a green August in the examined history.
- Bitcoin traded around $77,661 on August 29, down 2% over 24 hours and roughly 38.4% below its October 2025 all-time high of $126,080.
Bitcoin’s monthly returns data through late August 2026 show a strong positive figure for the current month alongside mixed historical patterns for the August-to-September transition.
Data from the heatmap covering years indicate specific cases of green Augusts followed by red Septembers. The August 2026 return registered at +26.07 percent in the available data up to that point.
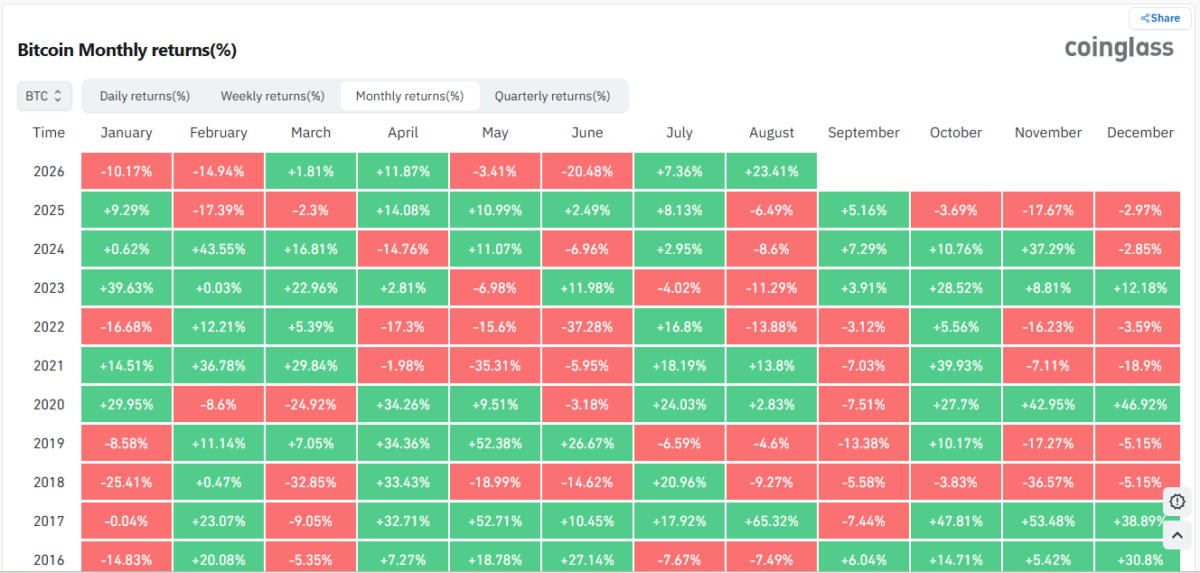
An X post dated August 28, 2026, from the account @rektfencer referenced this sequence, stating that Bitcoin has not recorded a green September after a green August in the examined history.
What did the post reference?
The account noted, “SEPTEMBER WILL BE A TRAP FOR $BTC BULLS. Bitcoin has NEVER had a green September after a green August. Not once. Will 2026 really be the first?” The post included a chart of historical monthly returns and drew attention to the sequence of positive August performance followed by September outcomes across prior years.
The following day, August 29, 2026, the same account stated: “FIRST DEATH CROSS IN 3 YEARS FOR $BTC. This is the strongest bullish signal seen in all past cycles. Meanwhile, everyone is preparing for $40K. You know what this means.”
These two posts form the core of recent discussion around Bitcoin’s near-term monthly pattern and technical signals.
Available market data contemporaneous with the post confirmed a death cross configuration on certain timeframes, with the 50-period moving average positioned below the 200-period moving average on the daily chart in some analyses, while shorter and longer timeframes showed varying structures.
What does current price level reveal
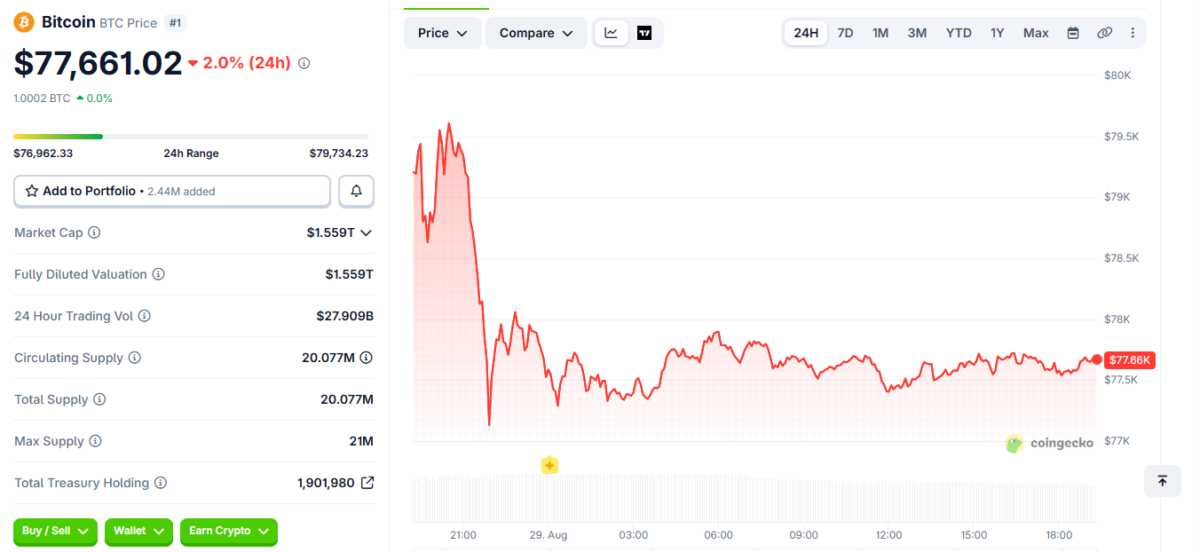
At the time of this writing (on August 29 at 14:00 UTC), Bitcoin traded at $77,661.02, down 2.0 percent over the prior 24 hours. The 24-hour range ran from $76,962.33 to $79,734.23. The seven-day range extended from $75,774.85 to $81,281.93.
The all-time high of $126,080 on 6 October 2025 left the price 38.4 percent below that level. Circulating supply stood at 20.077 million BTC, market capitalization at $1.559 trillion, and 24-hour trading volume at $27.909 billion.
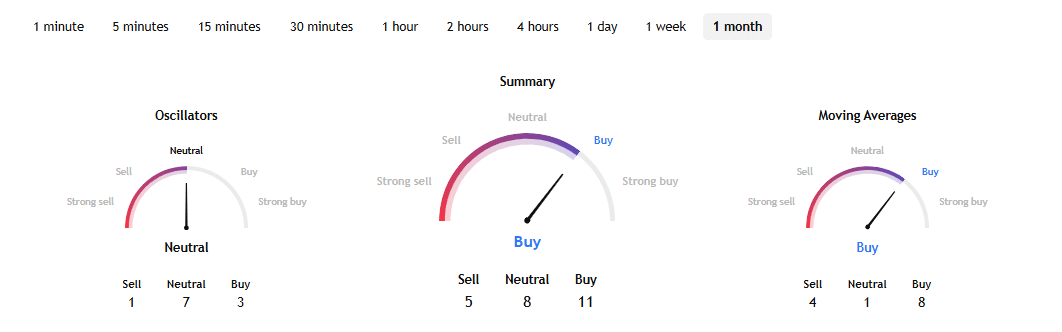
On the monthly timeframe, oscillators registered one sell, seven neutral, and three buy signals, classified as neutral. Moving averages showed four sell, one neutral, and eight buy signals, classified as buy. The summary gauge displayed five sell, eight neutral, and eleven buy signals, overall classified as Buy.
Pivot Level and Price Calculations
On a monthly timeframe, TradingView data shows that pivot point (P) stood at 96,067 for both methods. Fibonacci resistance levels were R1 at 115,869, R2 at 128,103, and R3 at 147,905. Fibonacci support levels were S1 at 76,265, S2 at 64,031, and S3 at 44,229.
Assuming that BTC moves in a positive direction and using the Fibonacci R2 of 128,103 relative to the current price of approximately $77,661, the percentage difference calculates to a gain of 64.95 percent after a month. According to this data, BTC can lie in a green zone.
In contrast, using the Fibonacci S2 of 64,031 relative to the same price level, the percentage difference calculates to a decline of 17.55 percent in the same period. If this happens, then BTC will repeat its historical cycle and lie in the red zone after witnessing a green August.
ZachXBT flags the account
Around two years ago, on October 9, 2024, ZachXBT flagged the account, accusing it of running 10+ accounts, sharing AI-generated posts, and deploying memecoin scams like ANALOS BALLZ and CATDOG.
Also Read: Cardone Capital Adds 1,200 BTC Through Real Estate Strategy