XRP has entered a period of pronounced social pessimism even as core network metrics show renewed engagement. Data from Santiment reveals that negative commentary surrounding the asset reached a three-month extreme in the days leading up to August 14, 2026, coinciding with a failure of XRP price to stage a sustained recovery and a move back below the $1 level.
At the same time, the XRP Ledger recorded 49,929 active addresses in a single 24-hour window—the highest daily total in more than two months. This divergence between crowded bearish narrative and rising on-chain participation forms the central development of the week.
Social Commentary Reaches Extreme Levels
Across major discussion channels including X, Reddit, and Telegram, the volume and intensity of negative references to XRP intensified throughout the week. Santiment’s aggregated sentiment metrics show the proportion of bearish commentary climbing to its highest reading since mid-May 2026.
The shift followed a period of price stagnation and gradual decline that left the asset trading under $1.00. Retail participants, in particular, expressed frustration over the lack of upward momentum, with discussions frequently highlighting missed rallies and relative underperformance.
Santiment’s tracking of social data captures both the frequency and the directional tone of mentions. The resulting chart overlay places the recent spike in negative sentiment against earlier periods of relative neutrality or mild optimism. The current reading stands out not merely as elevated but as a clear multi-month peak, indicating that the prevailing mood has swung decisively toward caution or outright skepticism.
Historically, such extremes in crowd psychology have sometimes preceded shifts in direction once underlying activity metrics begin to improve, though no outcome is predetermined.
On-Chain Activity Registers Multi-Month Peak
While social channels turned more negative, the XRP Ledger itself displayed a different picture. Its daily active addresses—the number of unique wallets that interacted with the network in a 24-hour period—climbed to 49,929, as shown in the Santiment data. This figure marks the highest level recorded in over two months and arrives after a stretch in July when activity had fallen close to the lower end of the 2026 range.
Active address counts serve as a direct measure of network utilization. The recent uptick suggests that a larger set of participants moved tokens, settled payments, or otherwise engaged with the ledger despite the cooler price environment.
Santiment’s combined visualization of price candles, active addresses, and negative sentiment levels makes the contrast visible: as the sentiment bars rose toward their three-month high, the address metric simultaneously expanded. The 49,929 reading therefore stands as a concrete data point rather than an inferred trend, grounded in ledger-level observations rather than price alone.
XRP Price Analysis
XRP is currently trading in a well-defined long-term downtrend on the daily chart, with price at approximately $1.001 after a modest 0.24% gain on the day. The asset remains firmly below all major exponential moving averages, including the 20-EMA near $1.039, the 50-EMA at $1.083, the 100-EMA at $1.164, and the 200-EMA at $1.355. This stacked EMA structure, with shorter-term averages below longer-term ones and price beneath the entire cluster, confirms sustained bearish momentum.
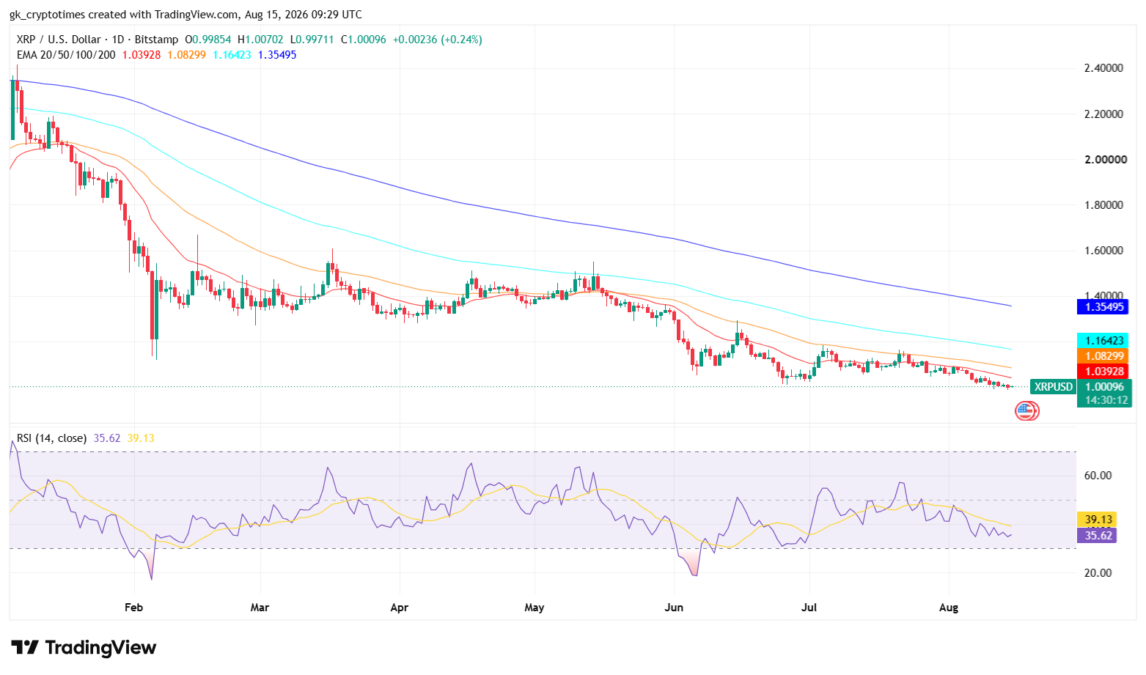
XRP’s recent price action has been characterized by lower highs and lower lows since early 2026, with the pair struggling to reclaim the $1.05–$1.10 zone and repeatedly testing support around the psychological $1.00 level.
As shown in the YTD chart from TradingView, the 14-period RSI currently sits at 35.62, with its signal line near 39.13, placing momentum in the lower half of the range but not yet in extreme oversold territory below 30. This reading reflects persistent selling pressure without immediate exhaustion, as the oscillator has oscillated between roughly 30 and 55 for several months without producing a strong bullish divergence.
For now, immediate support lies at the recent lows near $0.997, while resistance is marked by the descending 20-EMA around $1.04 and the broader $1.08 area. Until price can close decisively above the short-term EMAs with improving RSI, the technical structure continues to favor downside risk or prolonged consolidation near current levels.
Contrasting Signals and Market Context
The simultaneous occurrence of extreme social negativity and elevated network activity creates a classic divergence. Price has retreated below the psychologically watched $1 threshold, reinforcing the bearish tone in public discussion. Yet the rise in active addresses indicates that underlying demand for ledger usage has not collapsed.
Santiment frames this combination as the type of counter-signal that market participants often monitor closely: loud fear on social platforms paired with measurable participation on the chain itself.
Whether the higher activity ultimately translates into sustained demand or simply reflects short-term transactional needs remains an open question. What the data currently establish is the existence of the gap. Negative commentary is at a three-month high; active addresses are at a two-month high. Price sits under $1.00. These three observations, drawn directly from Santiment’s social and on-chain datasets, constitute the factual core of the present situation.
Market participants will continue to watch both streams of information. Further expansion or contraction in active addresses, together with any moderation or intensification of the sentiment extreme, will determine whether the current divergence narrows or widens in the days ahead.
Also read: Bitcoin Price Holds Near $63,000 as Early Bottom Signals Emerge