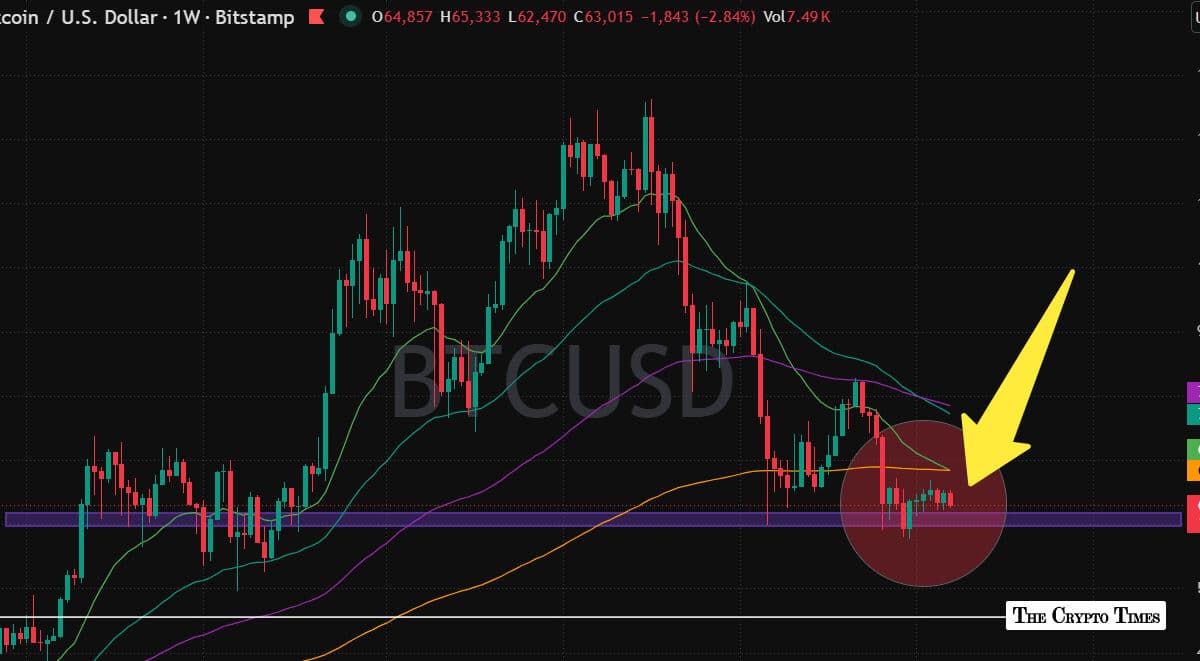
Bitcoin continues to navigate a challenging market environment as of August 15, 2026, holding steady around the $62,000 to $63,000 range after months of consolidation near this range.
The leading cryptocurrency briefly tested lows close to $58,000 in early July before rebounding, yet it remains under pressure from mixed macroeconomic factors, intermittent ETF flows, and cautious investor sentiment.
As traders assess whether the worst of the downturn is over, a combination of technical and on-chain data is drawing attention to potential stabilization points.
Current Price Action and Market Sentiment
Bitcoin’s price action in recent sessions has been characterized by range-bound trading, with support holding firm near recent lows while resistance has capped rallies around $65,000. As of 6:30 AM UTC (August 15, 2026), the asset is fluctuating near $63,000, reflecting a roughly 50% drawdown from its peak.
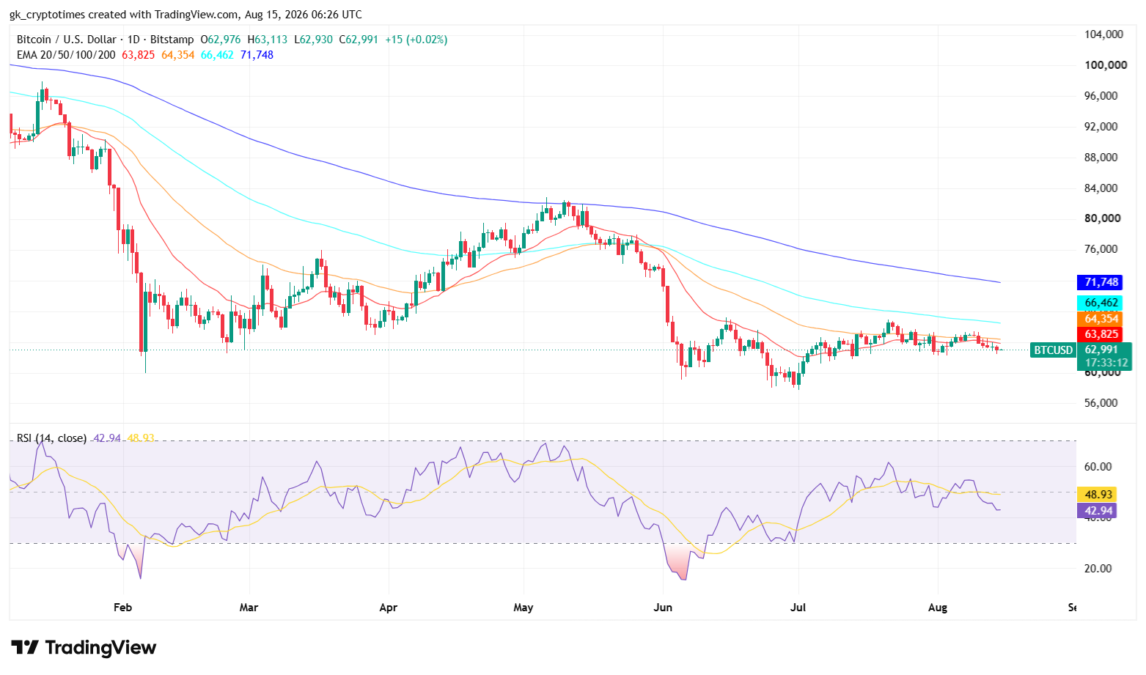
The current daily and weekly charts show price trading below several key moving averages, including the 50-day and 200-day levels, which continue to act as overhead resistance. Momentum indicators remain subdued: the Relative Strength Index on the daily timeframe sits near 43, indicating neither extreme oversold conditions nor strong buying pressure.
Market sentiment, as measured by CoinMarketCap’s Crypto Fear and Greed Index, has lingered in the “Fear” zone with readings between 29 and 38. This level of caution is notable but falls short of the extreme fear readings often associated with major cycle bottoms.
Besides, Spot Bitcoin ETF flows have been mixed, recording $389.71 million in net outflows for the week ending on 14th August, as per SoSoValue data, with occasional inflow streaks providing temporary support, yet overall institutional demand has not yet delivered a decisive turnaround.
The broader crypto market correlations with traditional assets, including a rising link with gold in recent weeks, have fueled renewed discussion of Bitcoin’s digital gold narrative, though price has lagged some safe-haven peers.
On-Chain and Cycle Indicators Point to Stabilization
Beyond pure price charts, on-chain analytics firms have highlighted several metrics that historically align with late-stage corrections. CryptoQuant’s Bull-Bear Market Cycle Indicator recently produced a second early bull signal, a development that analyst notes has previously coincided with the formation of bottoms rather than continued sharp declines.
In general, following the first early bull signal, a further decline occurred. The second early bull signal indicated a bottom,” said the anonymous analyst CW8900 of the CryptoQuant. “Currently, a second early bull signal has appeared. This signifies another bottom signal. The second early bull signal was the phase where a bottom was forming and an uptrend began. It is highly likely that Bitcoin is currently forming a bottom.”
Additional cycle-based tools, including certain relative strength comparisons against equity markets measured over multi-month periods, are approaching completion of rare patterns that marked major lows in 2015, 2018, and 2022.
Valuation metrics present a nuanced picture. The MVRV ratio has hovered near 1.2, suggesting the market is no longer deeply overvalued but has not yet reached the sub-1.0 territory that defined some prior generational bottoms. Reserve Risk and similar long-term holder confidence indicators have entered historically significant zones, while a portion of supply continues to sit at unrealized losses.
These data and analyst’s points collectively suggest seller exhaustion is building, even if full capitulation has not been confirmed across every metric.
Long-Term Holder NUPL Signal Gains Attention
One of the more closely watched developments involves long-term holder metrics, specifically the Net Unrealized Profit/Loss (NUPL) for this cohort. Long-term holder NUPL is at 0.17 and now sits below the broader market average, meaning even the typically resilient holders who accumulated earlier in the cycle are currently underwater relative to the overall market. This exact configuration—long-term holders experiencing greater relative losses—has appeared at previous major cycle bottoms and is widely viewed as a signal of potential bottom formation.
This data from CryptoQuant shows that long-term holders now account for a rising share of realized losses, with daily figures previously peaking near levels last seen in late 2022. While the depth of these losses has not yet matched the most extreme historical capitulations, the shift into negative NUPL territory for this group is interpreted by many observers as evidence that selling pressure from strong hands may be nearing exhaustion.
Combined with Bitcoin trading near estimated cost-of-production zones in some models, the LTH NUPL reading adds weight to the case that a structural low could be forming.
Looking ahead, confirmation of any bottom will likely require sustained ETF inflows, a reclaim of key technical levels such as the 20-day or 50-day moving averages, and an improvement in broader risk appetite. Until then, the market remains in a delicate balance.
The confluence of the long-term holder NUPL signal with other early bull indicators offers a constructive backdrop for longer-term observers, yet short-term volatility and external catalysts continue to warrant caution. Bitcoin’s next decisive move will depend on whether these on-chain signs translate into lasting price support.
Also read: Saylor May Still Sell More Bitcoin to Support STRC: Peter Schiff